How to access detailed student report
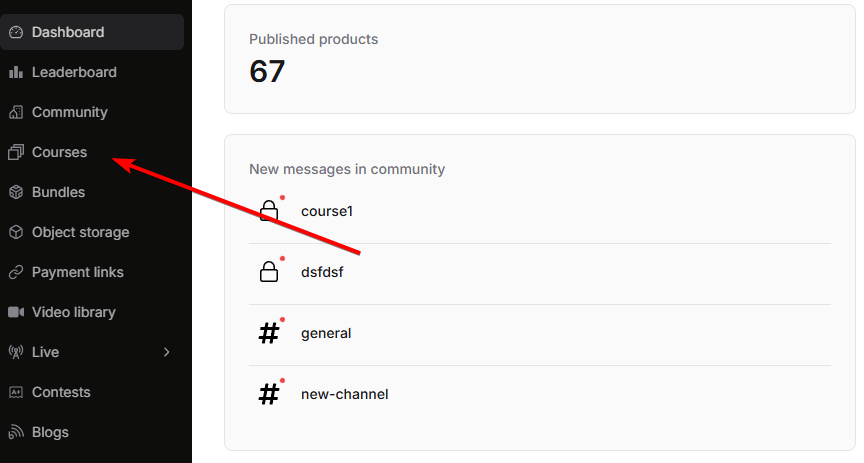
Select the course
Student analytics are unique for every course. Click on the course for which you want to check student analytics.

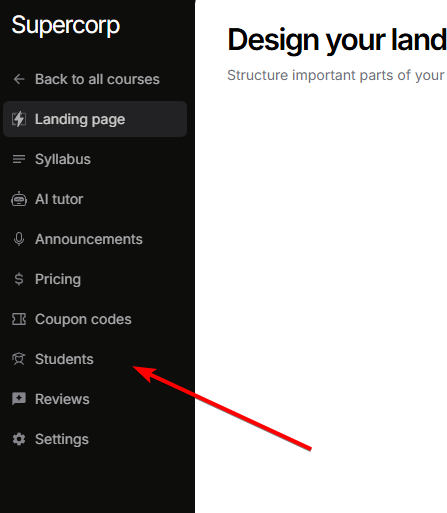
Select a student
Once you’re inside the 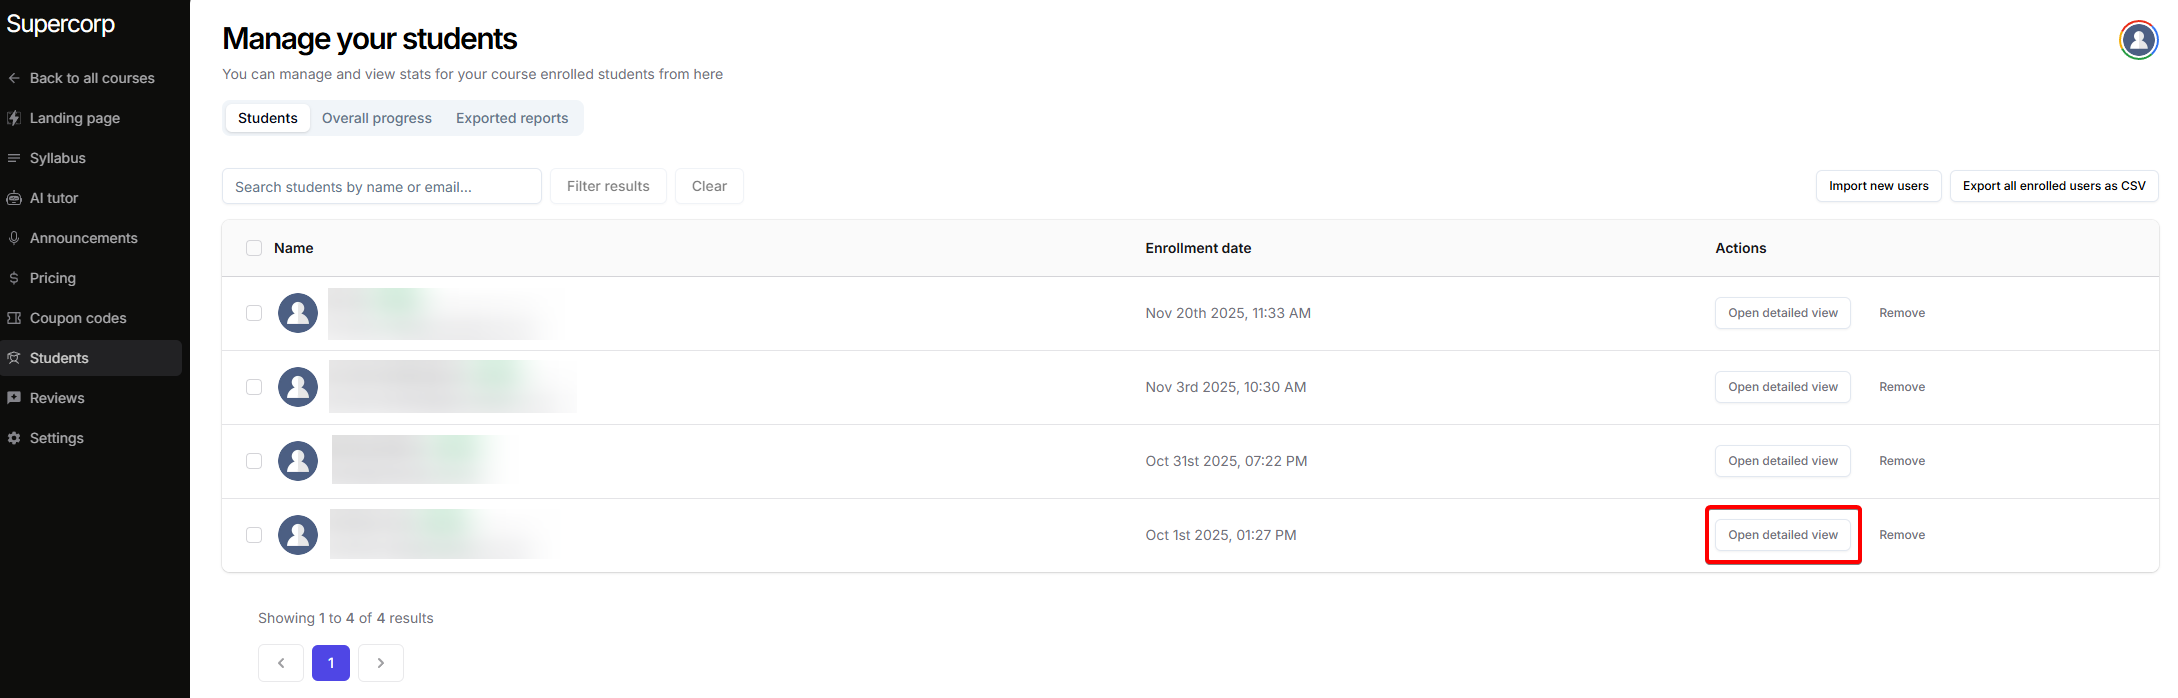
students tab, you will find a list of all students enrolled in the course. Click on any student to view their detailed analytics.
Dashboard overview
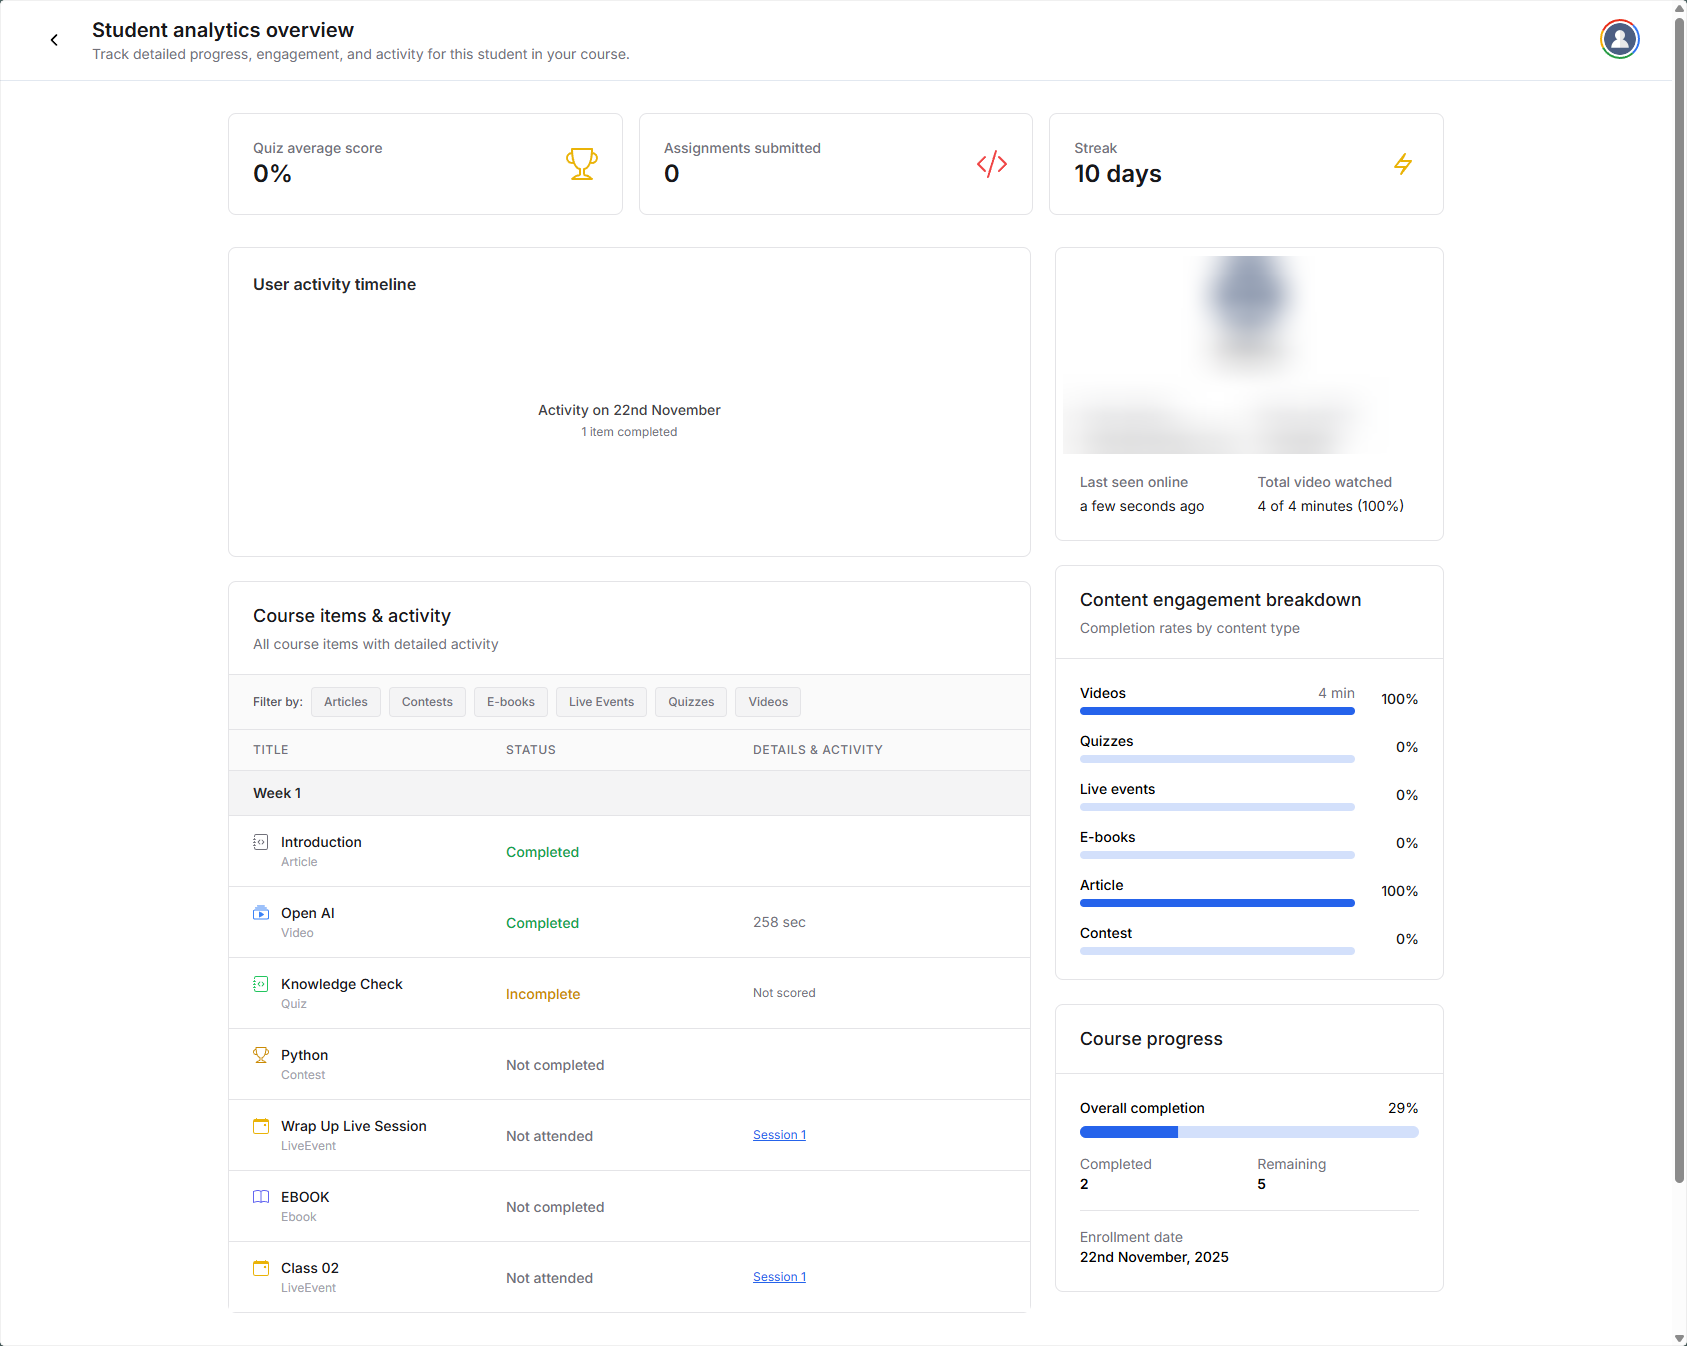
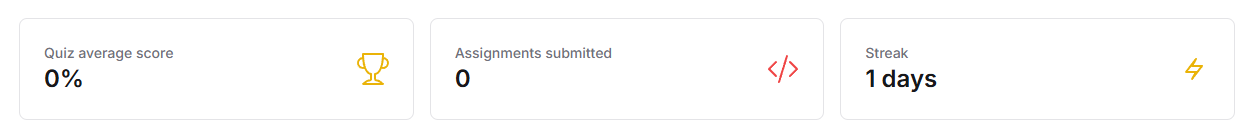
The detailed student report dashboard is organized into several key sections:Summary metrics
At the top of the dashboard, you’ll see key performance indicators:- Quiz average score: Overall average percentage across all quizzes completed by the student
- Assignments submitted: Total number of assignments the student has submitted
- Streak: Current consecutive days the student has been active on the platform These metrics provide a quick snapshot of the student’s engagement and performance.
Student profile card
The student profile section displays essential contact and activity information:- Email address: Student’s registered email
- Phone number: Contact number (if available)
- Last seen online: Timestamp showing when the student was last active
- Total video watched: Total video content consumed with completion percentage

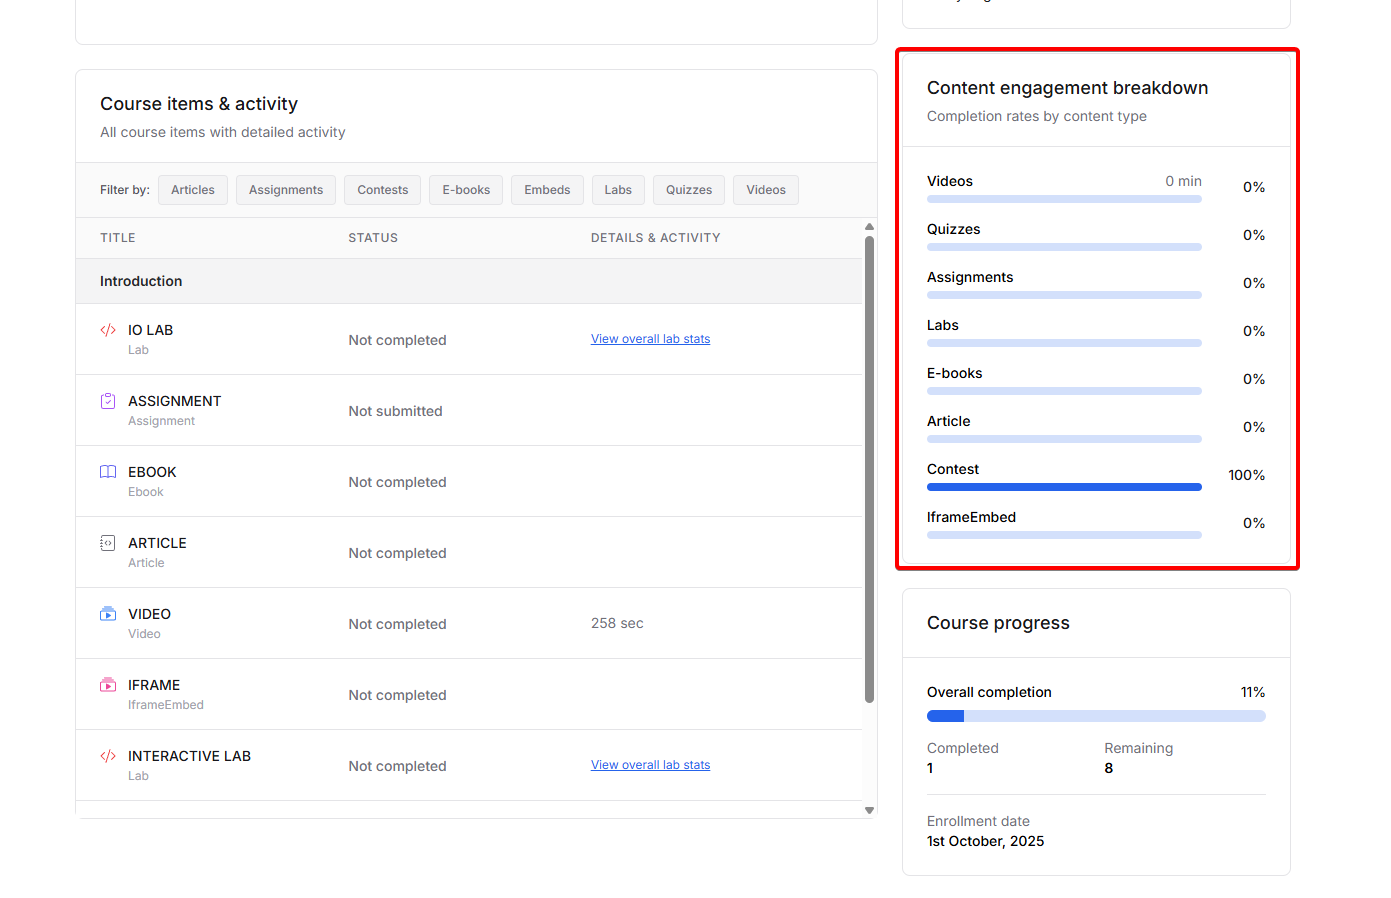
Content engagement breakdown
This section shows completion rates by content type, displayed as horizontal progress bars:- Videos: Total time watched and completion percentage
- Quizzes: Completion status and performance
- Live events: Attendance and participation
- E-books: Reading progress
- Articles: Completion status
- Contests: Participation and completion
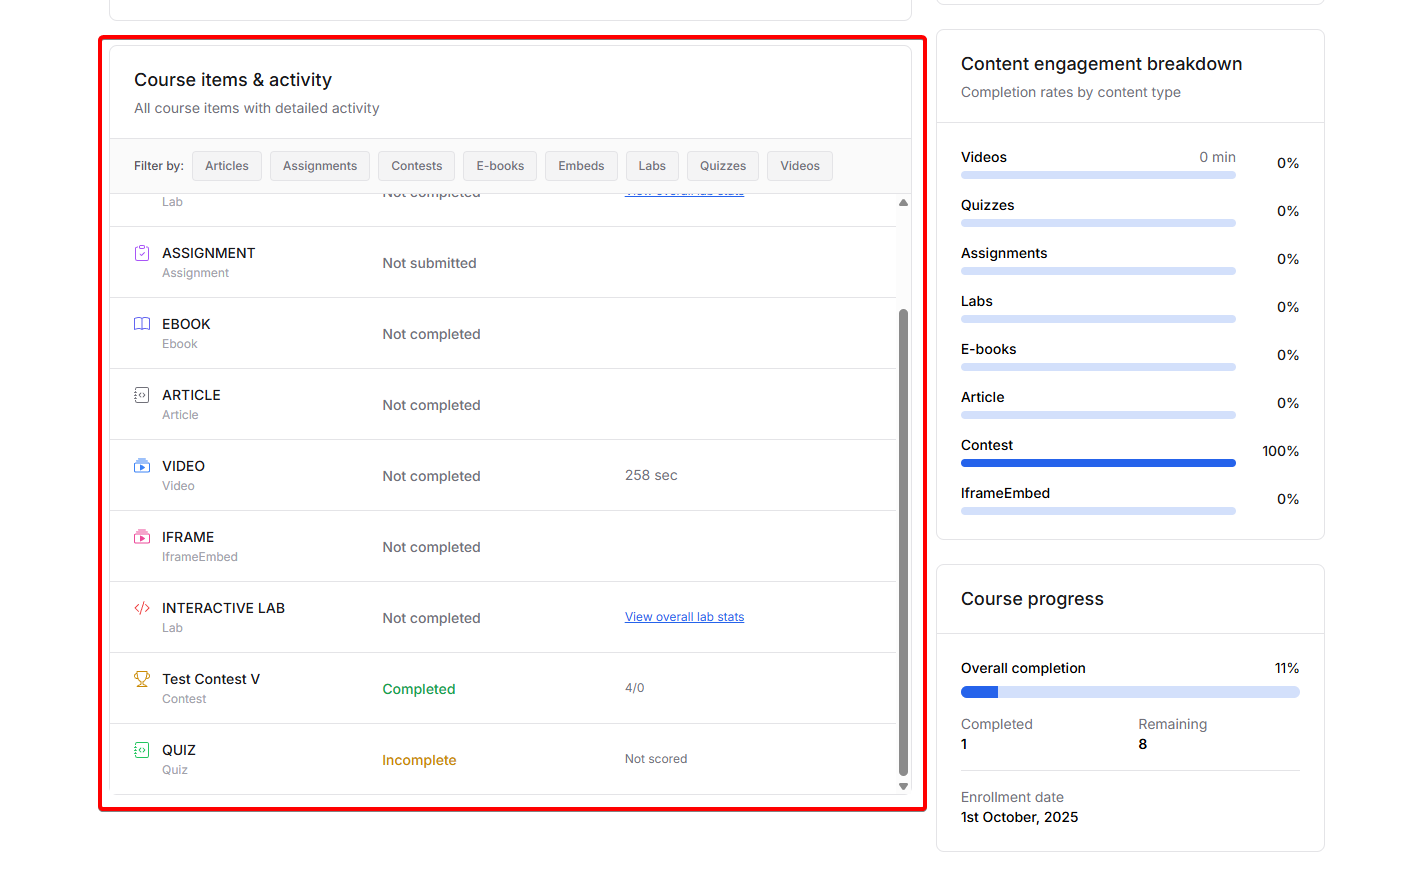
Course items & activity
The “Course items & activity” table provides a clear summary of every piece of course content a student has interacted with, as well as their progress and engagement for each item. Filter the table by content type to focus on specific areas-choose from Articles, Contests, E-books, Live Events, Quizzes, or Videos. For each course item, the table displays:- Item name: The title of the course content.
-
Status: Easily see if an item is:
- Completed - the student has finished the item.
- Incomplete - the item is in progress or only partially completed.
- Not completed - the item hasn’t been accessed.
- Not attended - for live events that were missed.
-
Details and activity: Depending on the content type, you’ll see:
- Videos: Time spent watching (e.g., “258 sec”).
- Quizzes: Scoring status (e.g., “Not scored”).
- Live events: Access links to session recordings or event information.
 This granular view allows you to identify exactly which course items students have completed, how much time they’ve spent on each, and where they might be struggling.
Course progress
The course progress section provides an overview of the student’s advancement:- Overall completion: Visual progress bar showing percentage completed
- Completed items: Number of course items the student has finished
- Remaining items: Number of items still to be completed
- Enrollment date: When the student first enrolled in the course
Using the analytics
The detailed student report helps you:- Identify struggling students: Spot students who have low completion rates or haven’t engaged with key content
- Recognize high performers: Find students who are excelling and might benefit from advanced content
- Track engagement patterns: Understand when and how students interact with your course
- Provide targeted support: Use the data to reach out to students who need help with specific content types
- Monitor progress: Track individual student advancement through your course curriculum
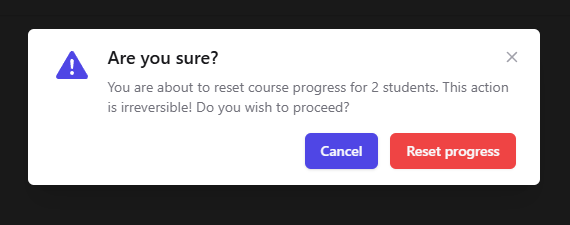
Bulk reset progress for multiple students
You can reset course progress for multiple students at once from the Students tab. This is useful when you need to allow students to retake a course or reset their progress after course content updates.Select students
Use the checkboxes in the student table to select the students whose progress you want to reset. You can select individual students or use the header checkbox to select all students on the current page.
Open Actions menu
Click on the
Actions dropdown button located in the top right corner of the Students tab, next to the “Export all enrolled users as CSV” button.Reset course progress
From the Actions dropdown menu, select 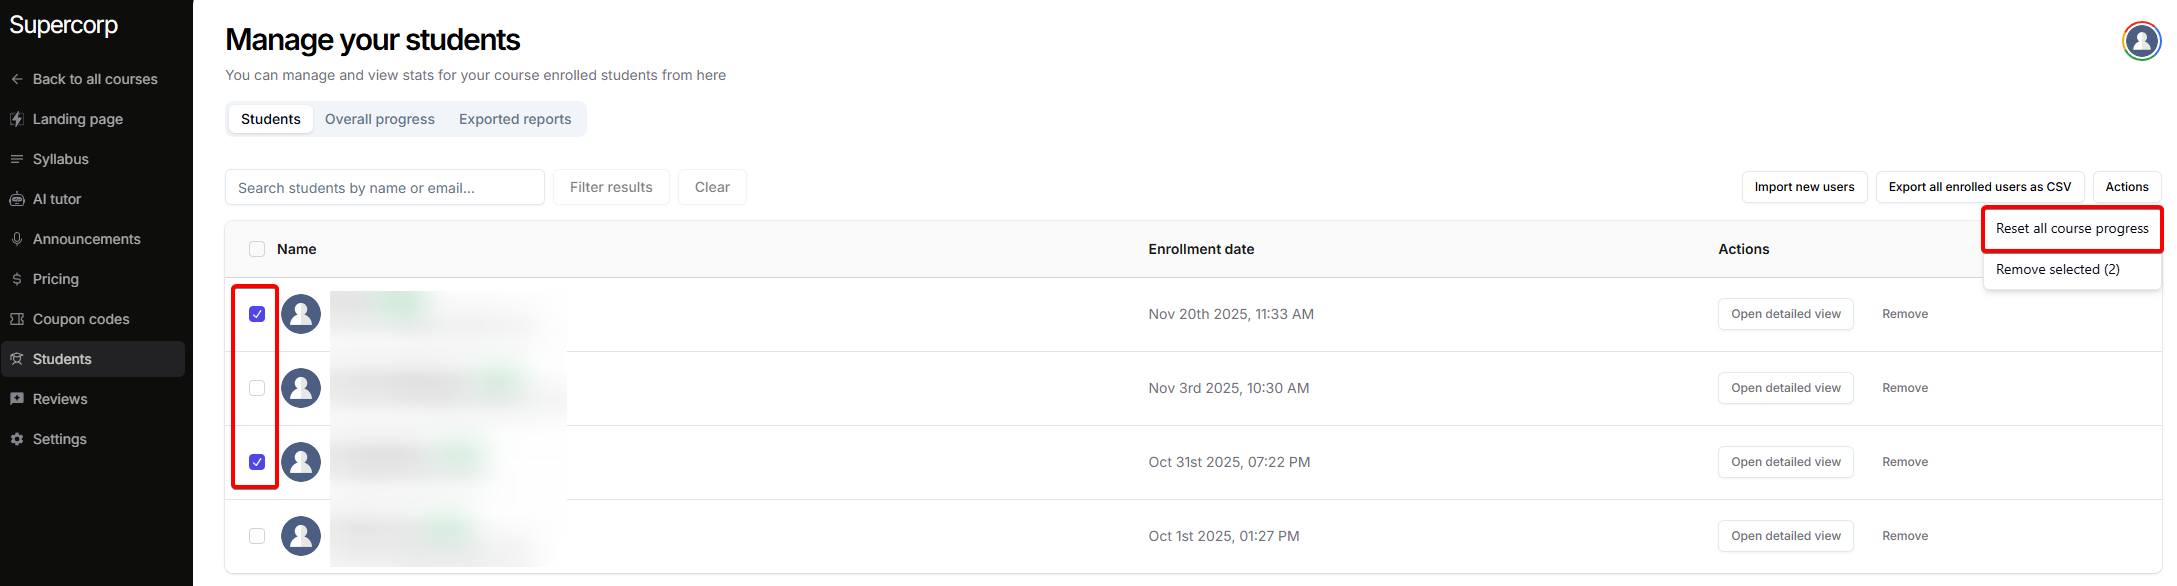
Reset all course progress to reset the progress for all selected students. This will clear all their course completion data, including