Accessing the earnings dashboard
Follow these steps to access your earnings page:1
Open Instructor Dashboard
After logging in to your school, navigate to your Instructor Dashboard.
2
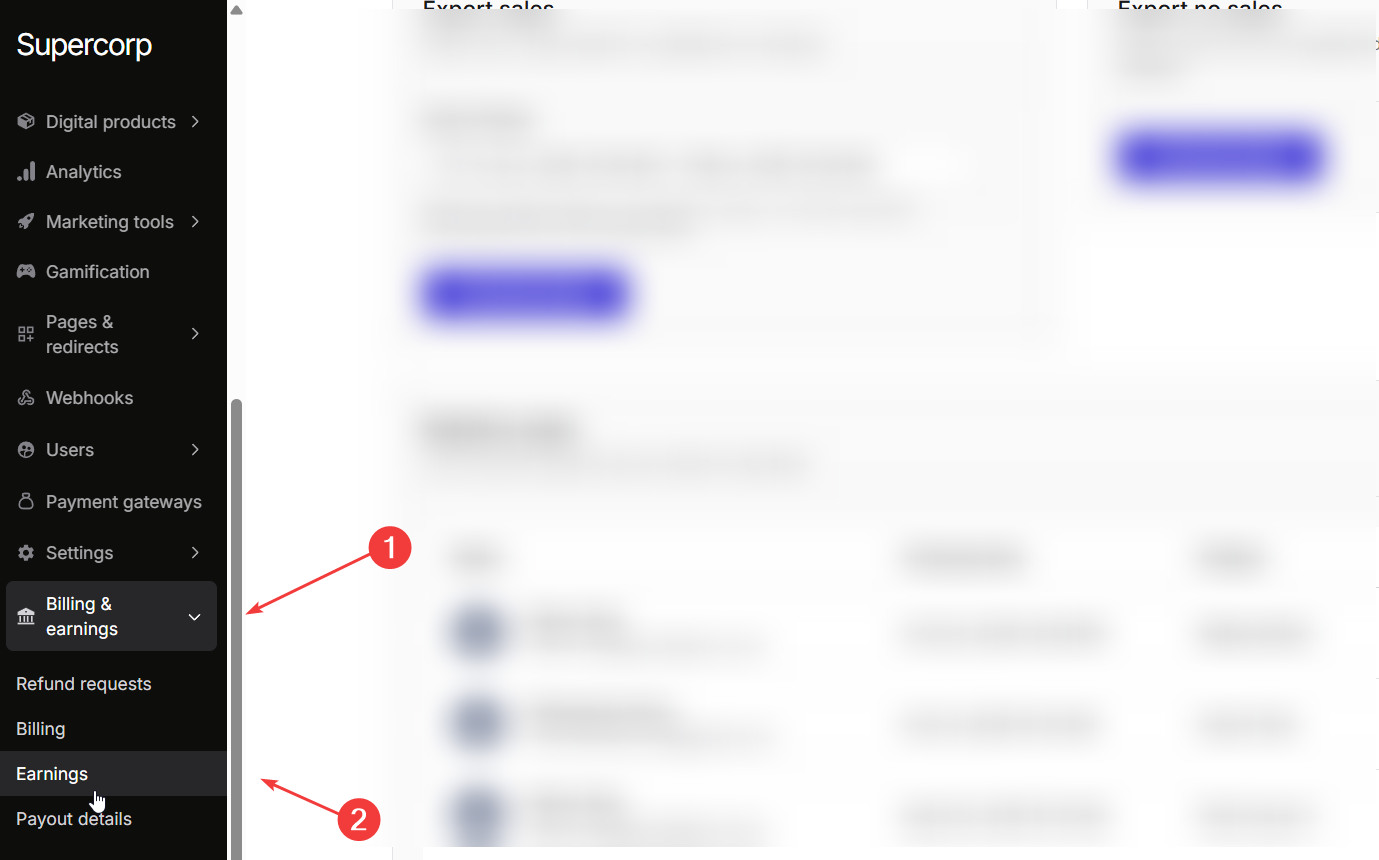
Find billing & earnings
In the sidebar menu, scroll down to the Billing and Earnings section.
3
Click on earnings
Select Earnings to open your earnings dashboard.
Revenue overview
The top section of your earnings dashboard displays your revenue trends and total sales within a selected date range.You can easily switch the date range (for example, Oct 8 - Oct 22, 2025) to see how your income changes over time.
- Revenue in Range: The total revenue generated within the selected period.
Example:
₹56000for Oct 8 - Oct 22, 2025. - Total Sales: The total number of successful purchases.
Example:
79 sales. - Chart Date Range: The period shown in the revenue graph.
- Revenue Graph: Visual representation of your daily revenue growth.
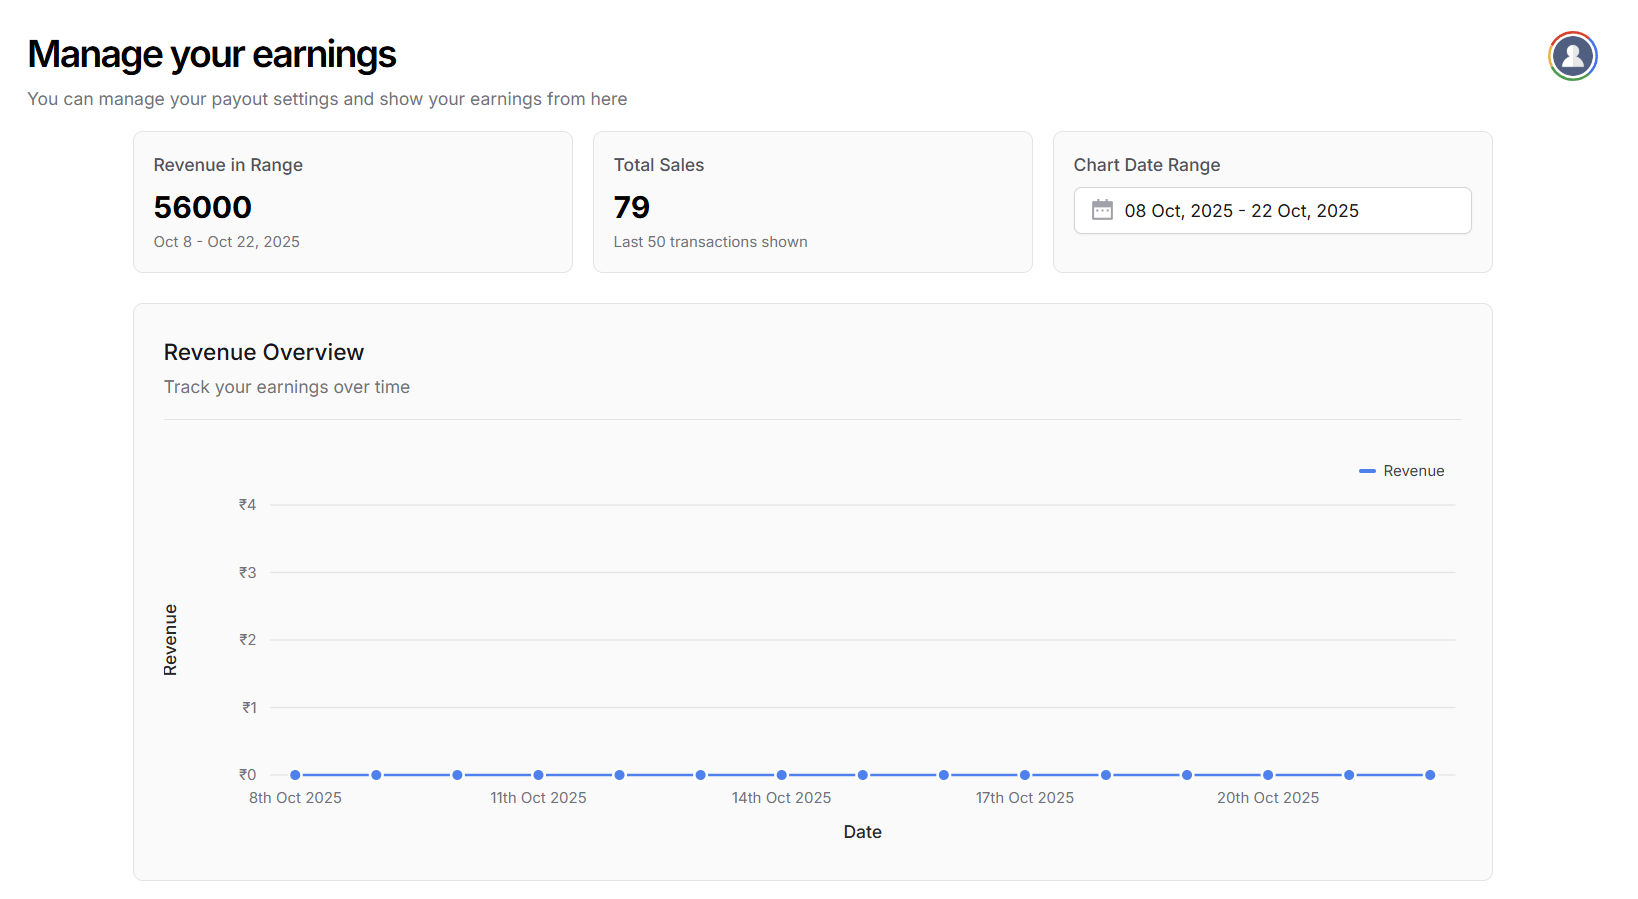 The chart allows you to track your earnings trends by date, helping you identify your best-performing days and products.
Export reports (sales & no sales)
You can export sales and user data from your earnings dashboard for accounting, compliance, or analytics purposes. Here’s how to access and use the export functionality:1
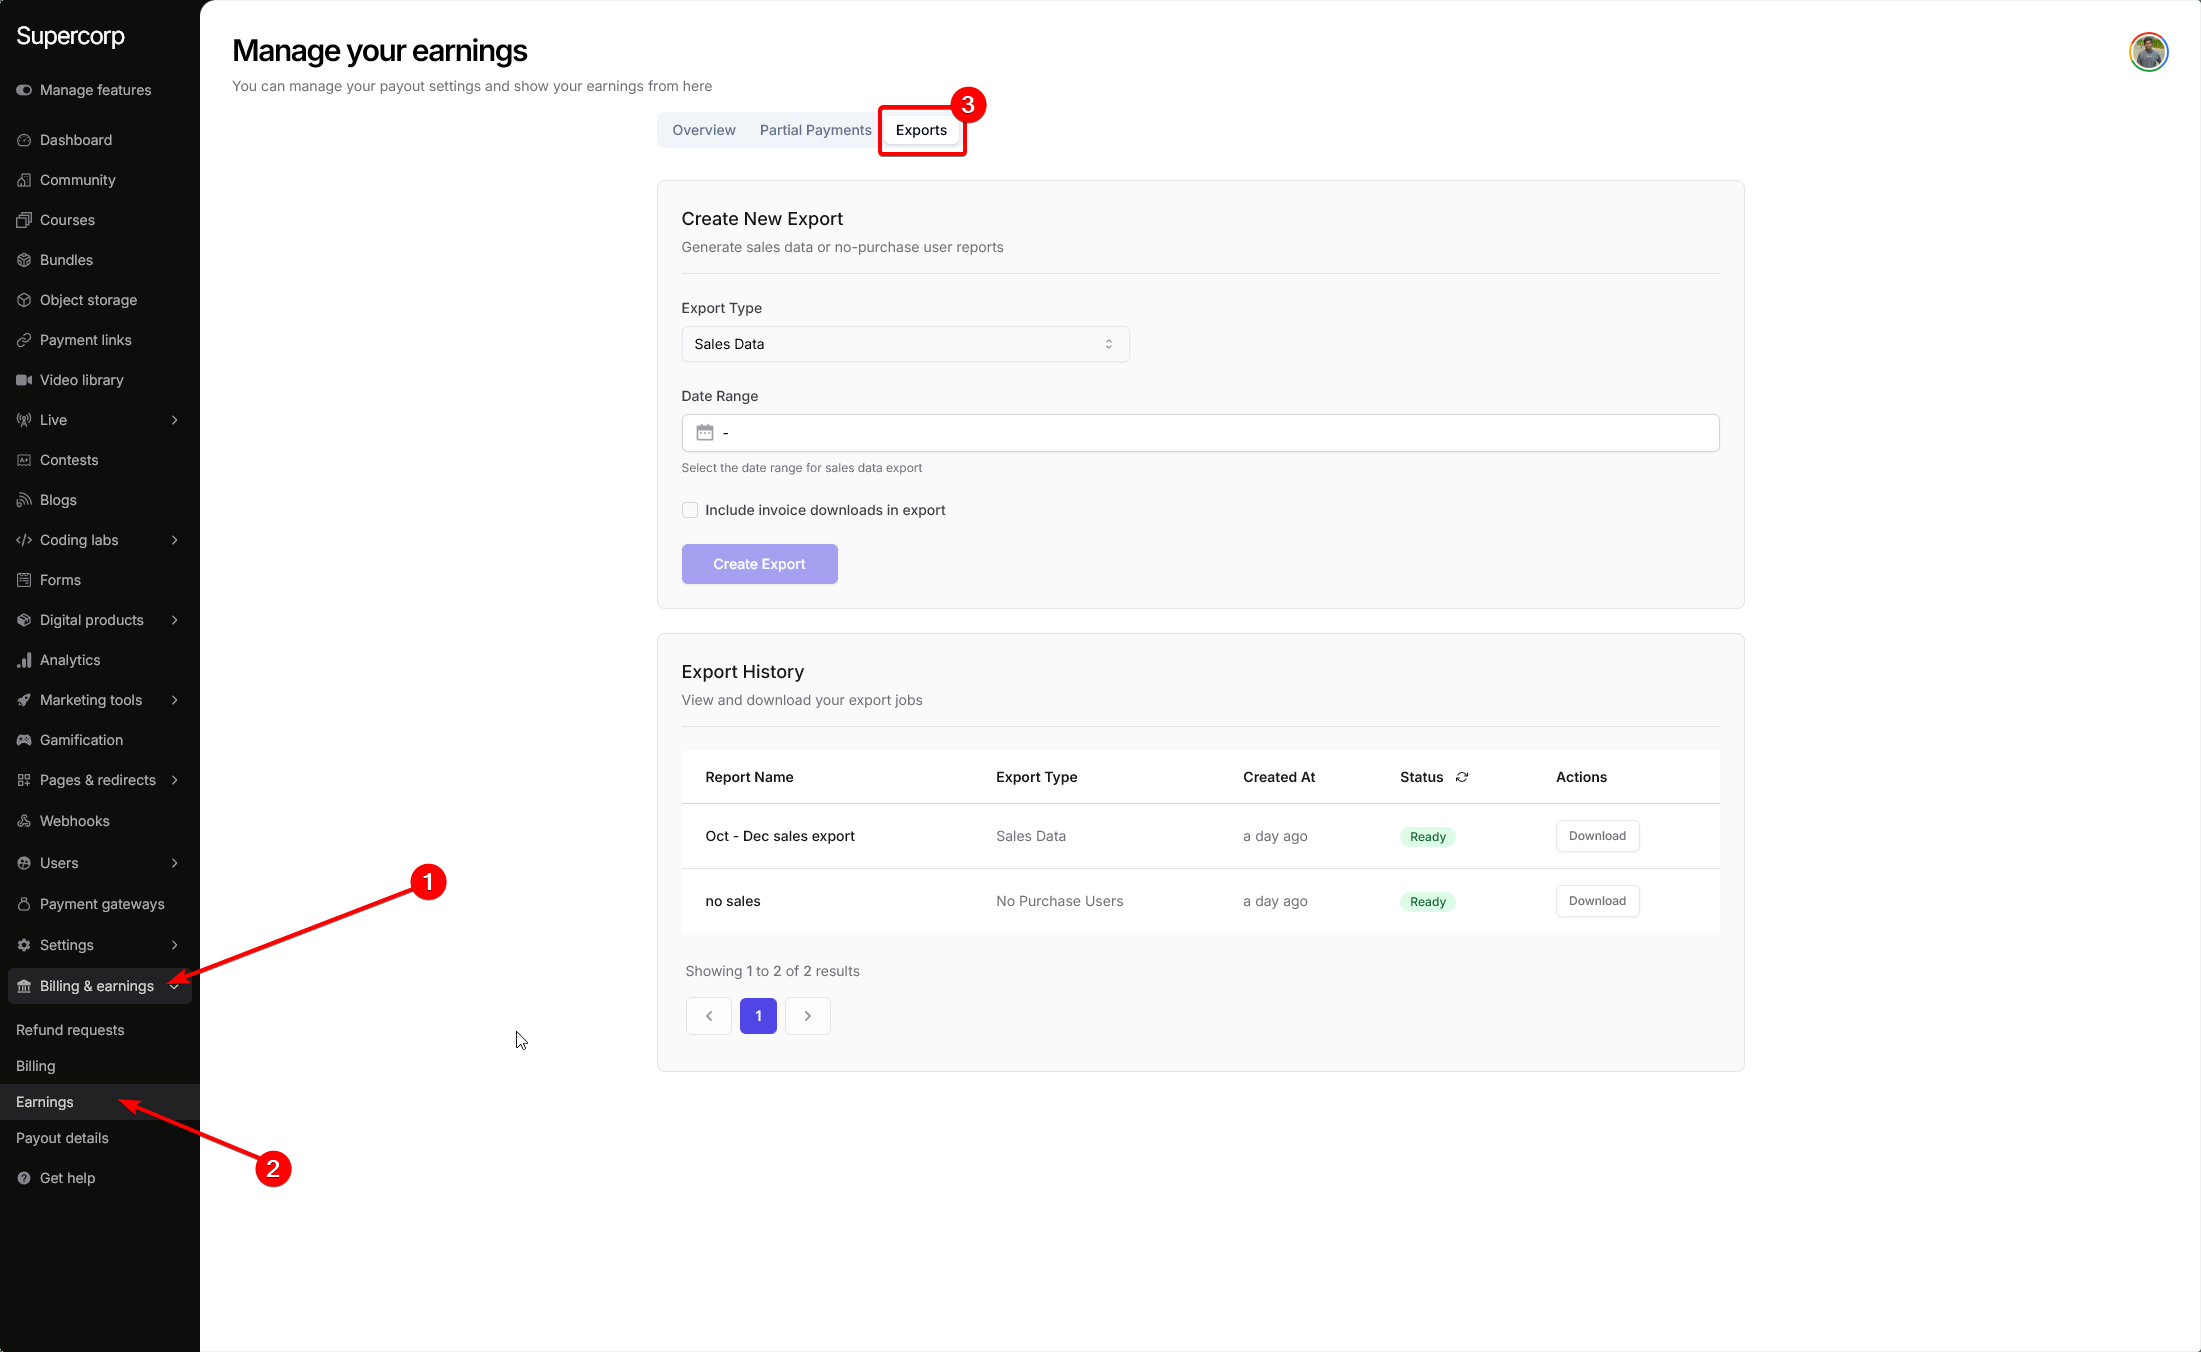
Navigate to export reports
Go to Billings & earnings → Earnings → select the Exports tab.
2
Choose export type
Use the Export Type dropdown to pick the kind of report you want to download:
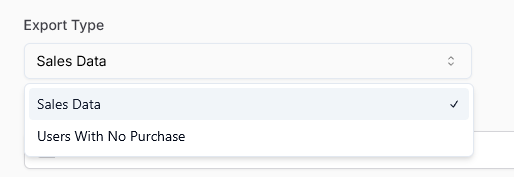
- Users with no purchase – Export a list of all registered users who have not made any purchases.
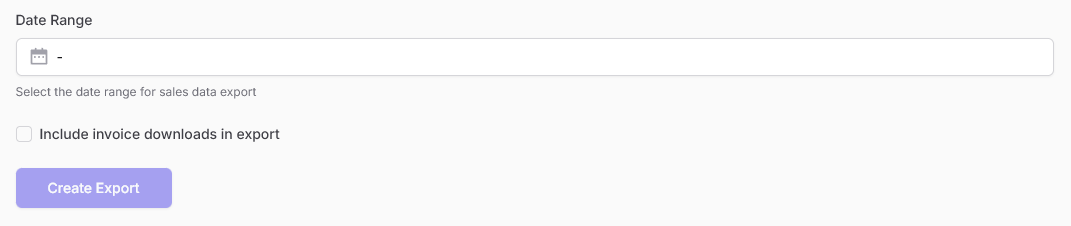
- Sales data – Export all sales for a date range. Selecting this shows more options:
- Select Date Range: Pick the start and end dates for your sales data export.
- Include invoice downloads: (optional) Check this box to include PDF invoices in your export.
3
Create and download export
Click Create Export.
- For Sales data: You’ll receive a ZIP containing a CSV of your sales report, and if selected, PDF invoices for all sales in the period.
- For Users with no purchase: You’ll receive a CSV with all users who have not purchased anything on your school.
4
Access export history
In the Exports tab, you’ll see a list of previous exports under Export History.
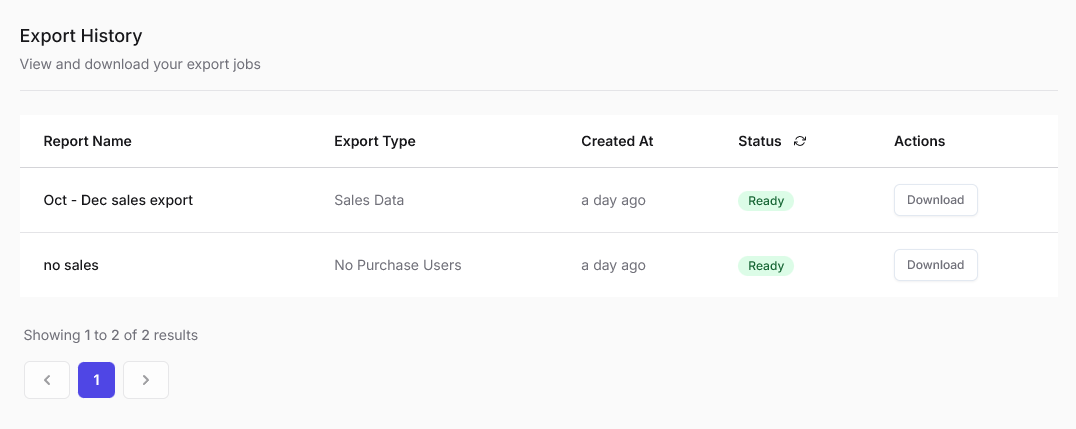
- Locate the report you want to download in the history list (sorted by date and type).
- Click the download icon next to the completed export to get your file.
- If the export is in progress, you’ll see a loading indicator—wait for it to complete before downloading.
Use exports for reconciling payments, tax compliance, deeper analysis, or to retarget users who haven’t made a purchase.
Realtime sales
The Realtime Sales section lists your most recent transactions (up to the last 50 sales) in real time. This view helps you stay up to date with every purchase that happens on your platform without waiting for daily summaries or exports.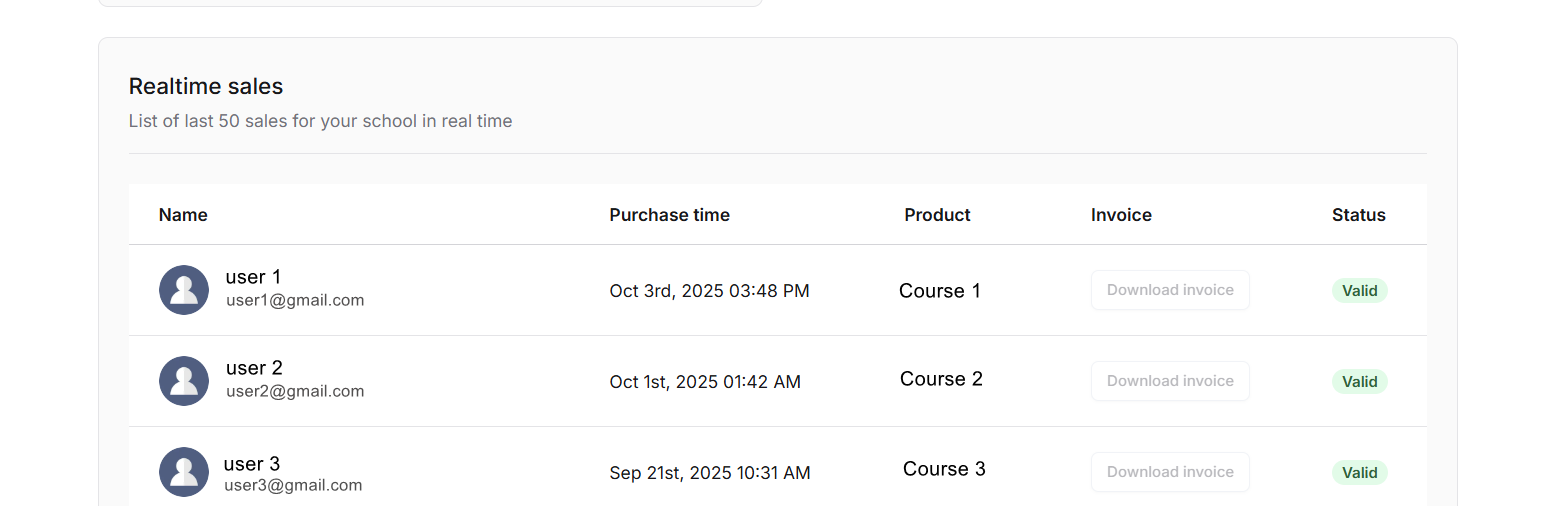 Each record displays key information about a sale: including the buyer’s name, purchase time, product purchased, invoice link, and payment status. You can use this list to quickly review who made a purchase, confirm successful payments, or troubleshoot any failed transactions. Each row also includes a direct link to download the invoice, making it easy to manage refunds or verify payment records.
Next steps
Manage Payouts
Configure your payout details to receive your earnings securely and on time.