Accessing the billing page
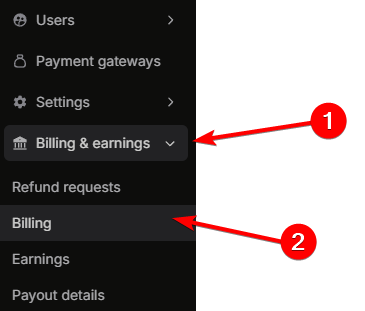
To open the Billing page:Navigate to Billing & earnings
In the sidebar, click Billing & earnings to expand the available configuration options.
Current plan
The top section of the billing page displays your active subscription plan. The header shows your plan name (e.g., Fermion Pro (Monthly)) along with the subscription date range (e.g., 01 Oct 2025 – Forever). This section is organized into two tabs:Plan details
The Plan details tab shows a summary of your plan’s pricing and billing terms, followed by a full breakdown of included usage limits and overage rates.Plan summary
| Field | Description |
|---|---|
| Base amount | The recurring subscription price for your plan (e.g., INR 4,999). |
| Cycle duration | The length of each billing cycle (e.g., 30 days). |
| Grace period | The number of days after a cycle ends before overages are finalized and charged (e.g., 7 days). |
Usage metrics
The usage metrics table lists every metered resource included in your plan, with the amount included per billing cycle and the overage rate charged when usage exceeds the included limit.| Metric | Included | Overage |
|---|---|---|
| Bandwidth | 1 TB | 20 USD per 1 TB |
| DRM | 5000 playbacks | 4 USD per 1000 playbacks |
| Storage | 100 GB | 2.5 USD per 100 GB |
| Interactive Lab | 1000 hours | 0.06 USD per 1 hour |
| DSA Lab | 50000 runs | 1 USD per 3000 runs |
| 3000 emails | 0.5 USD per 1000 emails | |
| AI Usage | 1 US Dollar | 1 USD per 1 US Dollar |
| Instructor Count | 10 individual count | 5 USD per 1 individual count |
| Edge Request | 10 million requests | 0.5 USD per 1 million requests |
| SMS India | 100 SMS | 1 USD per 100 SMS |
| AI Transcription Usage | 5 hours | 0.3 USD per 1 hour |
Billing cycles
The Billing cycles tab shows a chronological history of all your past and current billing cycles. Each row in the table displays:| Column | Description |
|---|---|
| Cycle | The sequential billing cycle number. |
| Start | The start date of the billing cycle. |
| End | The end date of the billing cycle. |
| Invoice ID | The unique identifier for the invoice generated for that cycle. |
| Status | The current state of the invoice — Completed (paid) or Pending (awaiting payment). |
| Actions | An Open invoice button to view or download the invoice. |
When an invoice has a Pending status, you can pay for it directly from this tab by clicking the action button next to the invoice. This allows you to settle outstanding invoices without leaving the billing page.
Current cycle usage
Below the current plan section, the Current cycle usage panel shows your real-time consumption for the active billing cycle. It displays your plan name and the cycle date range (e.g., Fermion Pro (Monthly) · Mar 1, 2026 – Mar 31, 2026).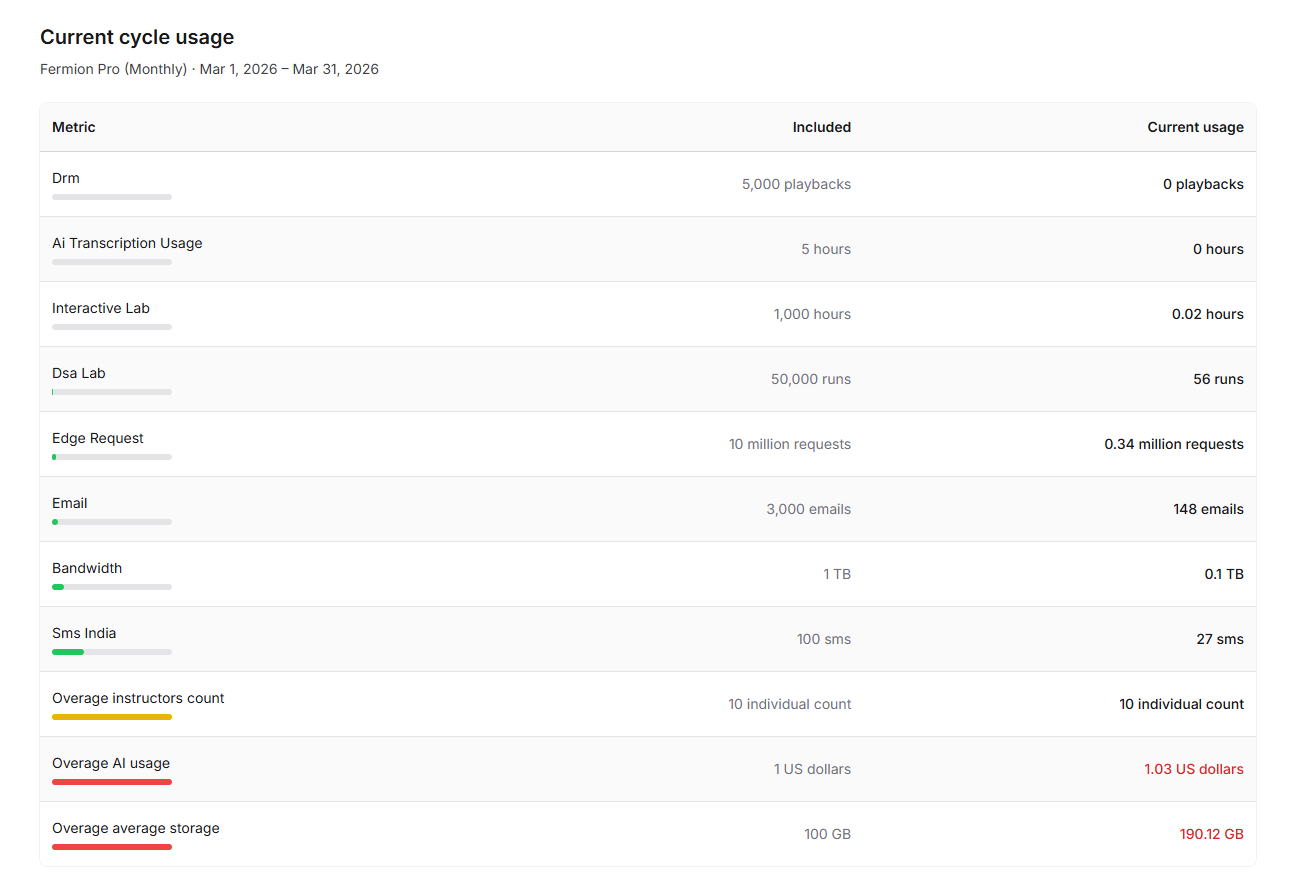 Each metric row shows:
- Metric name: The resource being tracked (e.g., DRM, Interactive Lab, Email, Bandwidth).
- Included: The amount included in your plan for the current cycle.
- Current usage: How much you have consumed so far.
- Progress bar: A visual indicator of consumption — displayed in green when within limits, orange when approaching the limit, and red when usage exceeds the included amount (overage).
Transaction ledger
The transaction ledger provides a chronological record of all transactions happening on your account — including student purchases and refunds.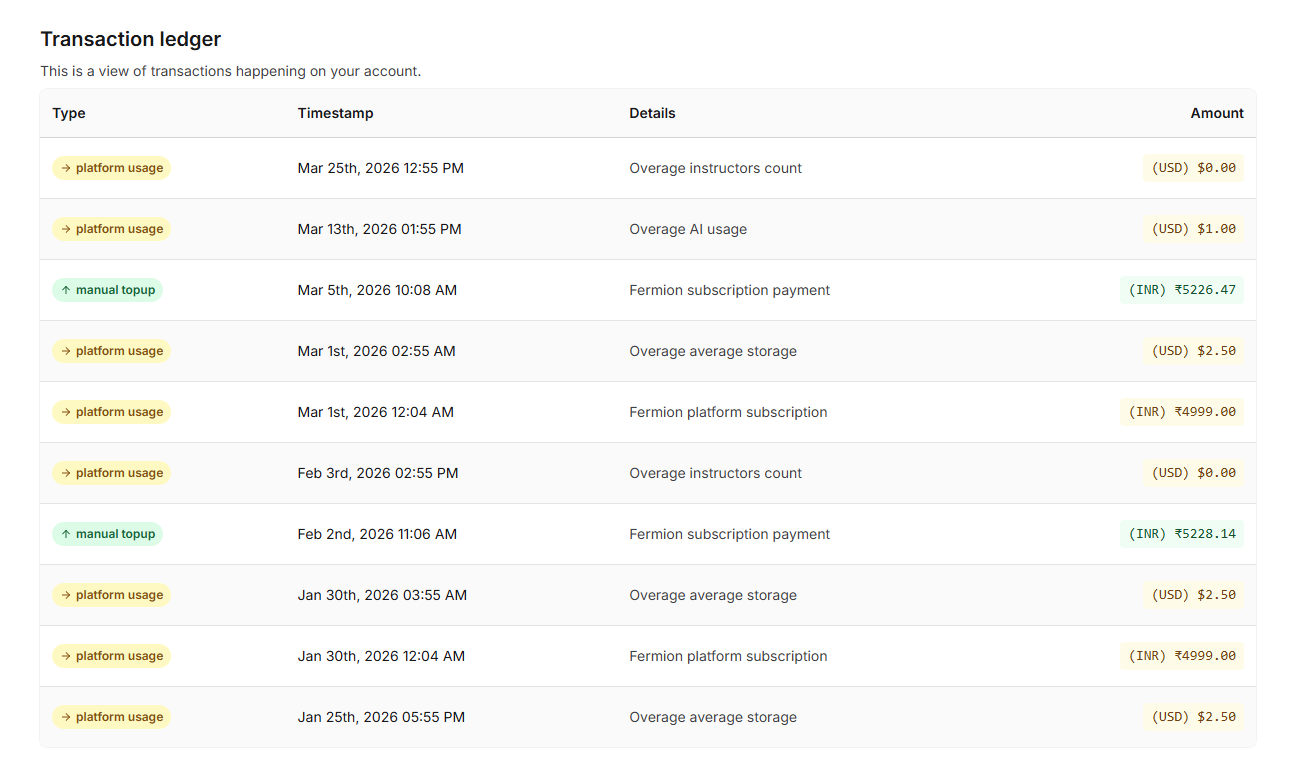 Each row in the ledger displays the following columns:
| Column | Description |
|---|---|
| Type | The kind of transaction — user sale (shown in green with an ↑ arrow) or user refund (shown in red with a ↓ arrow). |
| Timestamp | The exact date and time the transaction occurred (e.g., Mar 4th, 2026 06:29 PM). |
| Details | The payment gateway used for the transaction (e.g., UPI, Razorpay, PayPal, Stripe) along with the user’s email address. Refunded transactions display a Refunded badge next to the gateway. |
| Amount | The transaction amount with currency (e.g., (INR) ₹8,939.94) |
Transaction types
| Type | Description |
|---|---|
| User sale | Revenue collected from a student purchasing a course, bundle, or digital product. Displayed in green. |
| User refund | Amount returned to a student for a refunded purchase. Displayed in red. |
| Platform usage | Automatic charges from Fermion for subscription billing, overage fees, and platform resource consumption (e.g., Overage average storage, Overage AI usage, Overage instructors count, Fermion platform subscription). Displayed in yellow. |
| Manual topup | Manual payments made towards your Fermion subscription (e.g., Fermion subscription payment). Displayed in green. |
The ledger shows all transactions in reverse chronological order, with the most recent activity at the top. Each entry includes the payment gateway details so you can trace payments across providers like UPI, Razorpay, PayPal, and Stripe.
Next steps
Earnings
Track your revenue, view sales trends, and export detailed reports from your earnings dashboard.
Manage Payouts
Configure your payout details to receive your earnings securely and on time.