Accessing livestream analytics
You can view livestream statistics in two ways.1
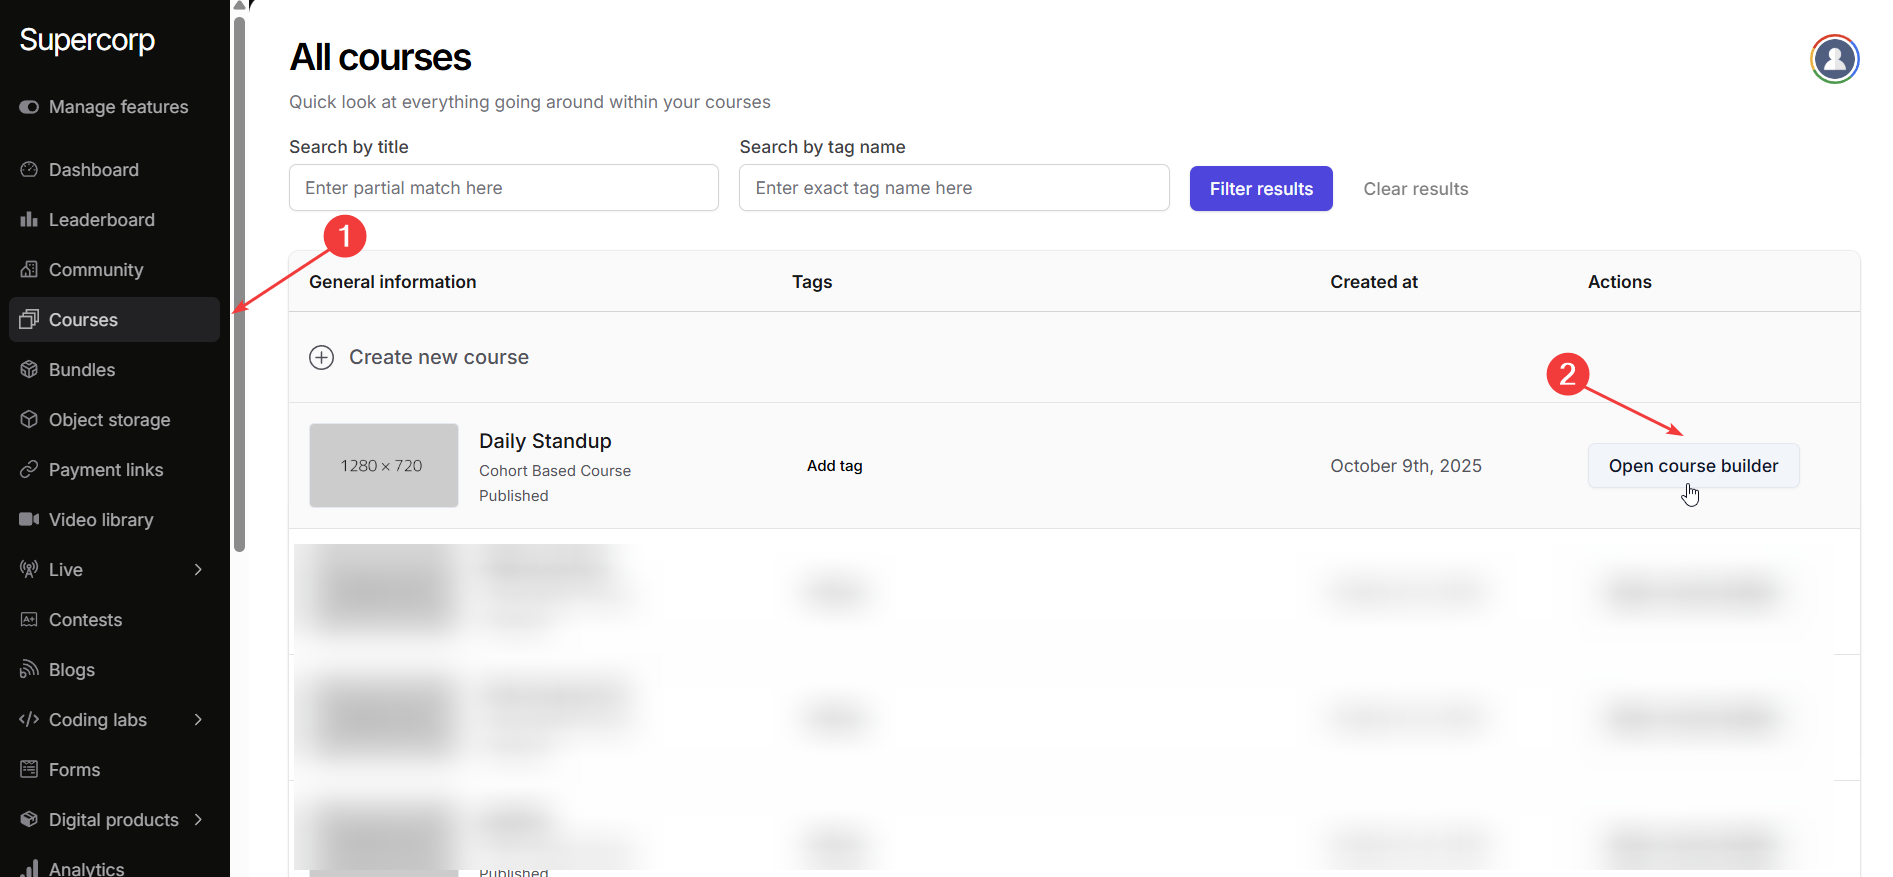
Open course builder
Head over to the Courses tab in your instructor dashboard sidebar and open the course builder
for the respective live stream session’s parent course.
2
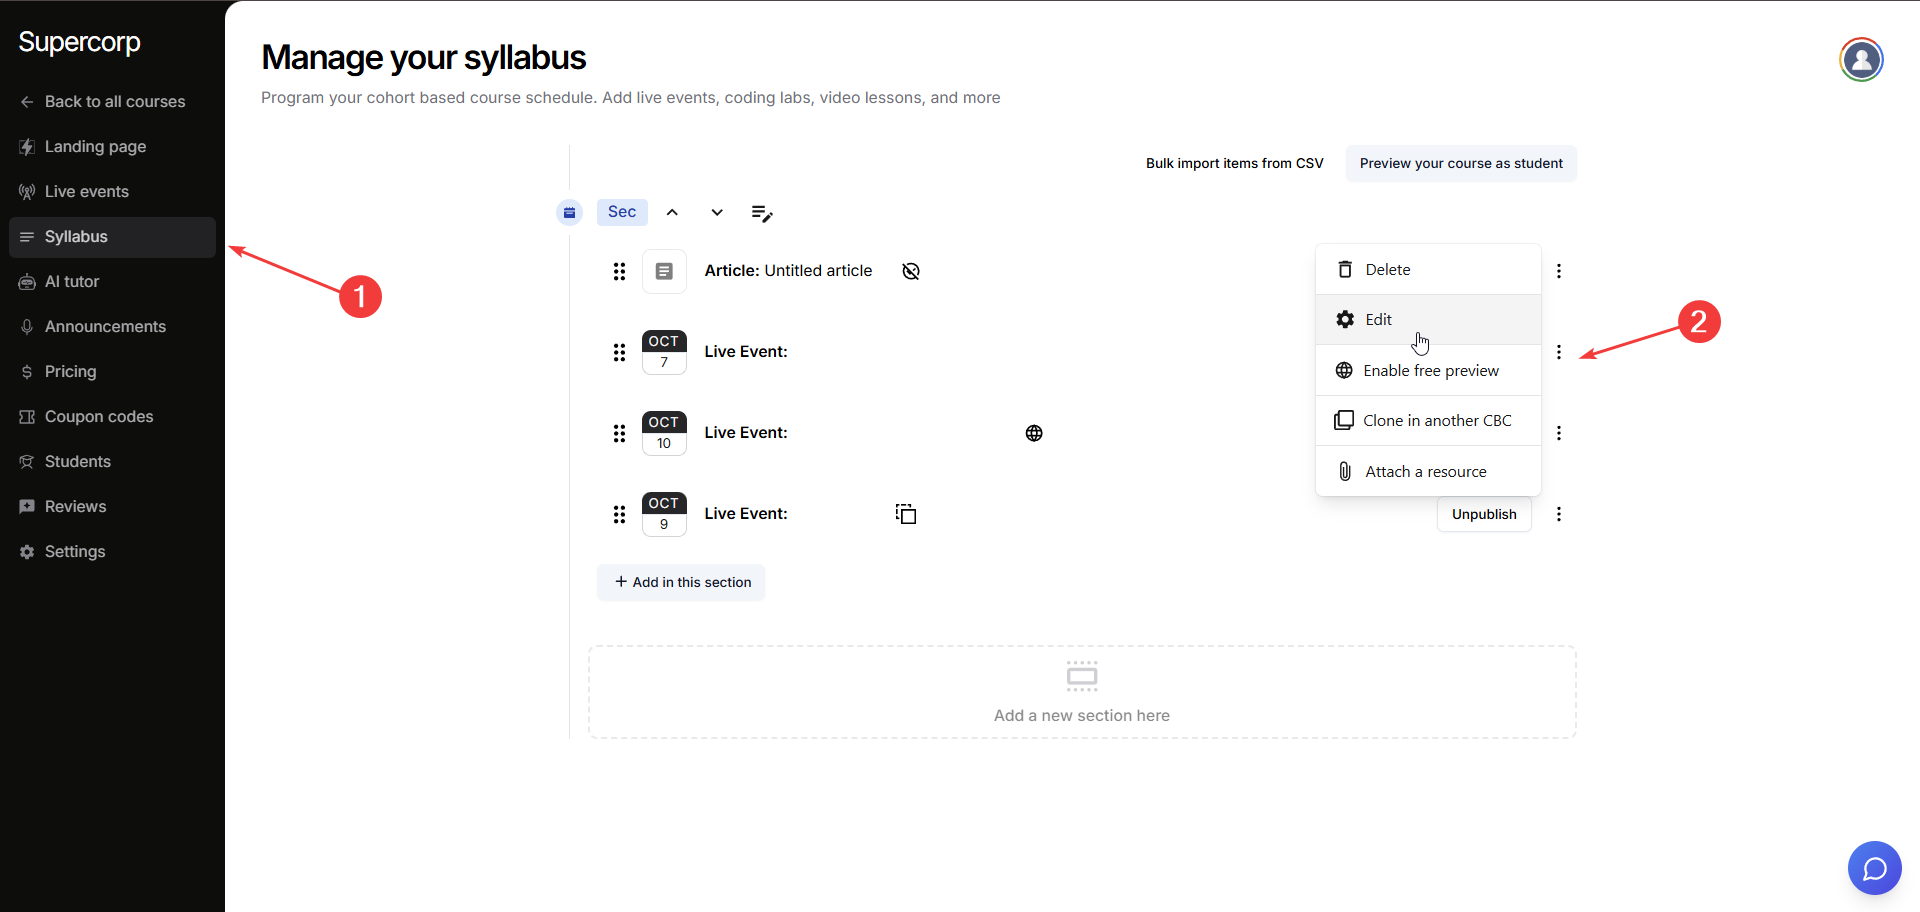
Access via syllabus
- Open the desired course and go to the Syllabus section. 2. Find the session that was
livestreamed, click the three dots (⋮) next to it, and select Edit. This will open the
live session manager.
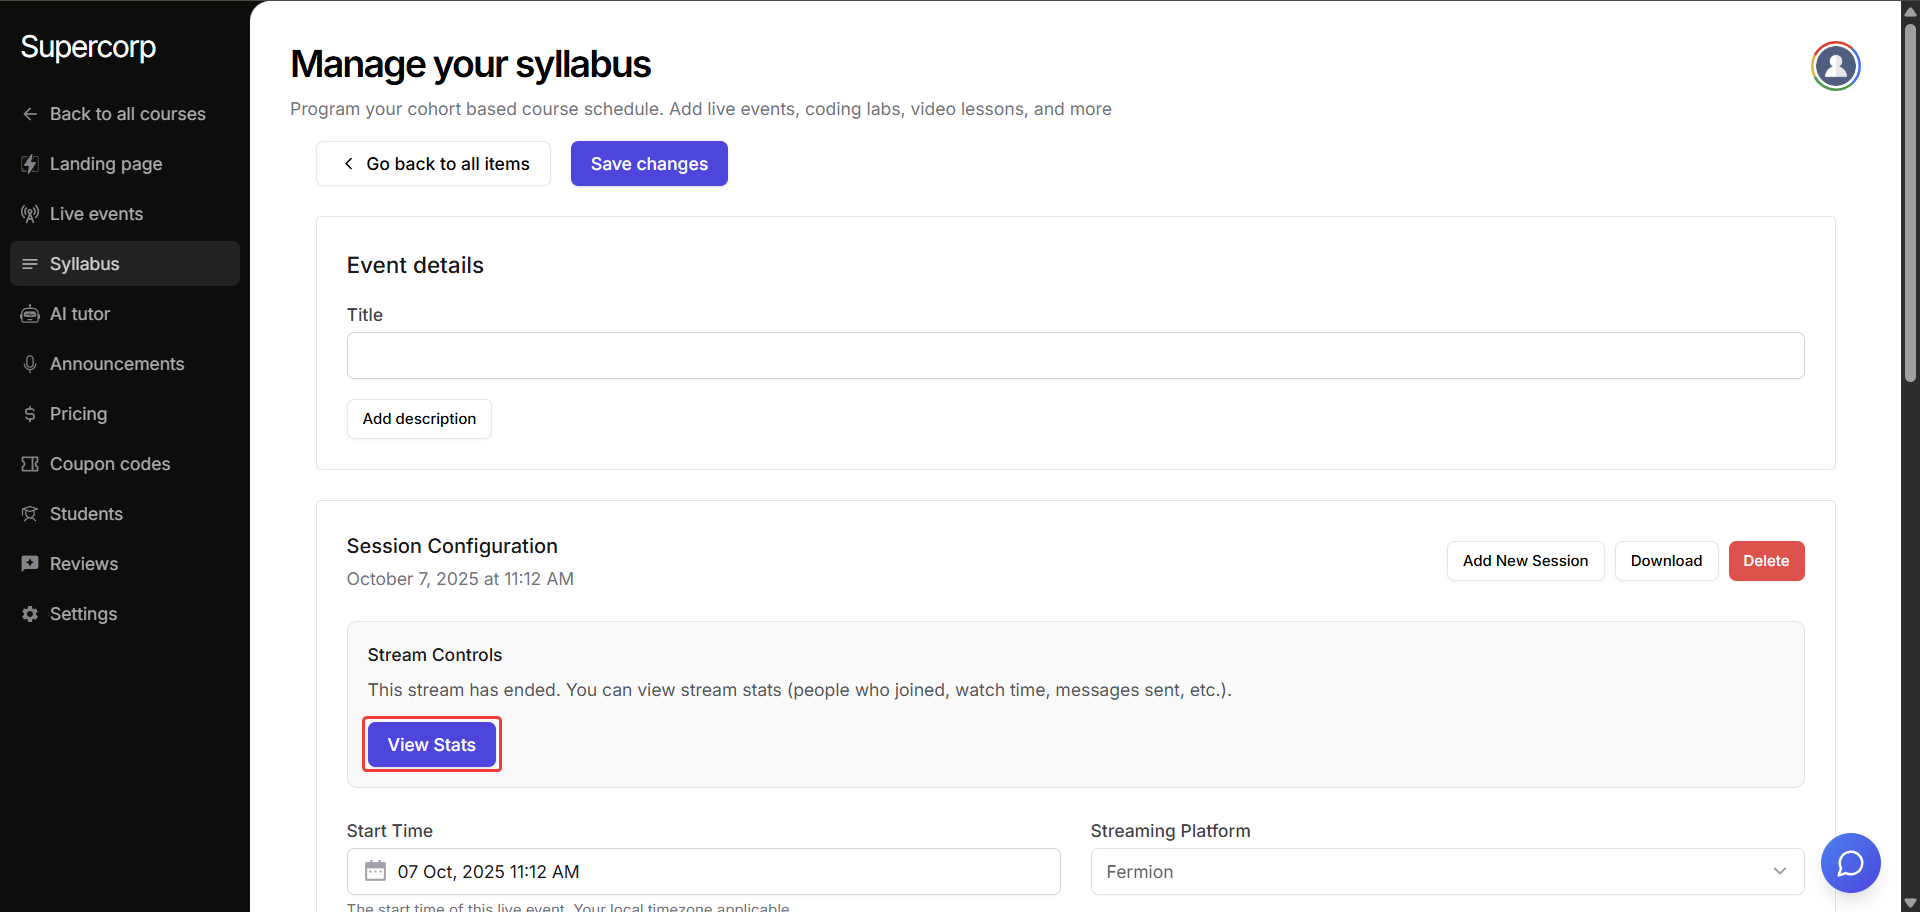
- Click VIew Stats to view detailed analytics for that specific session.
3
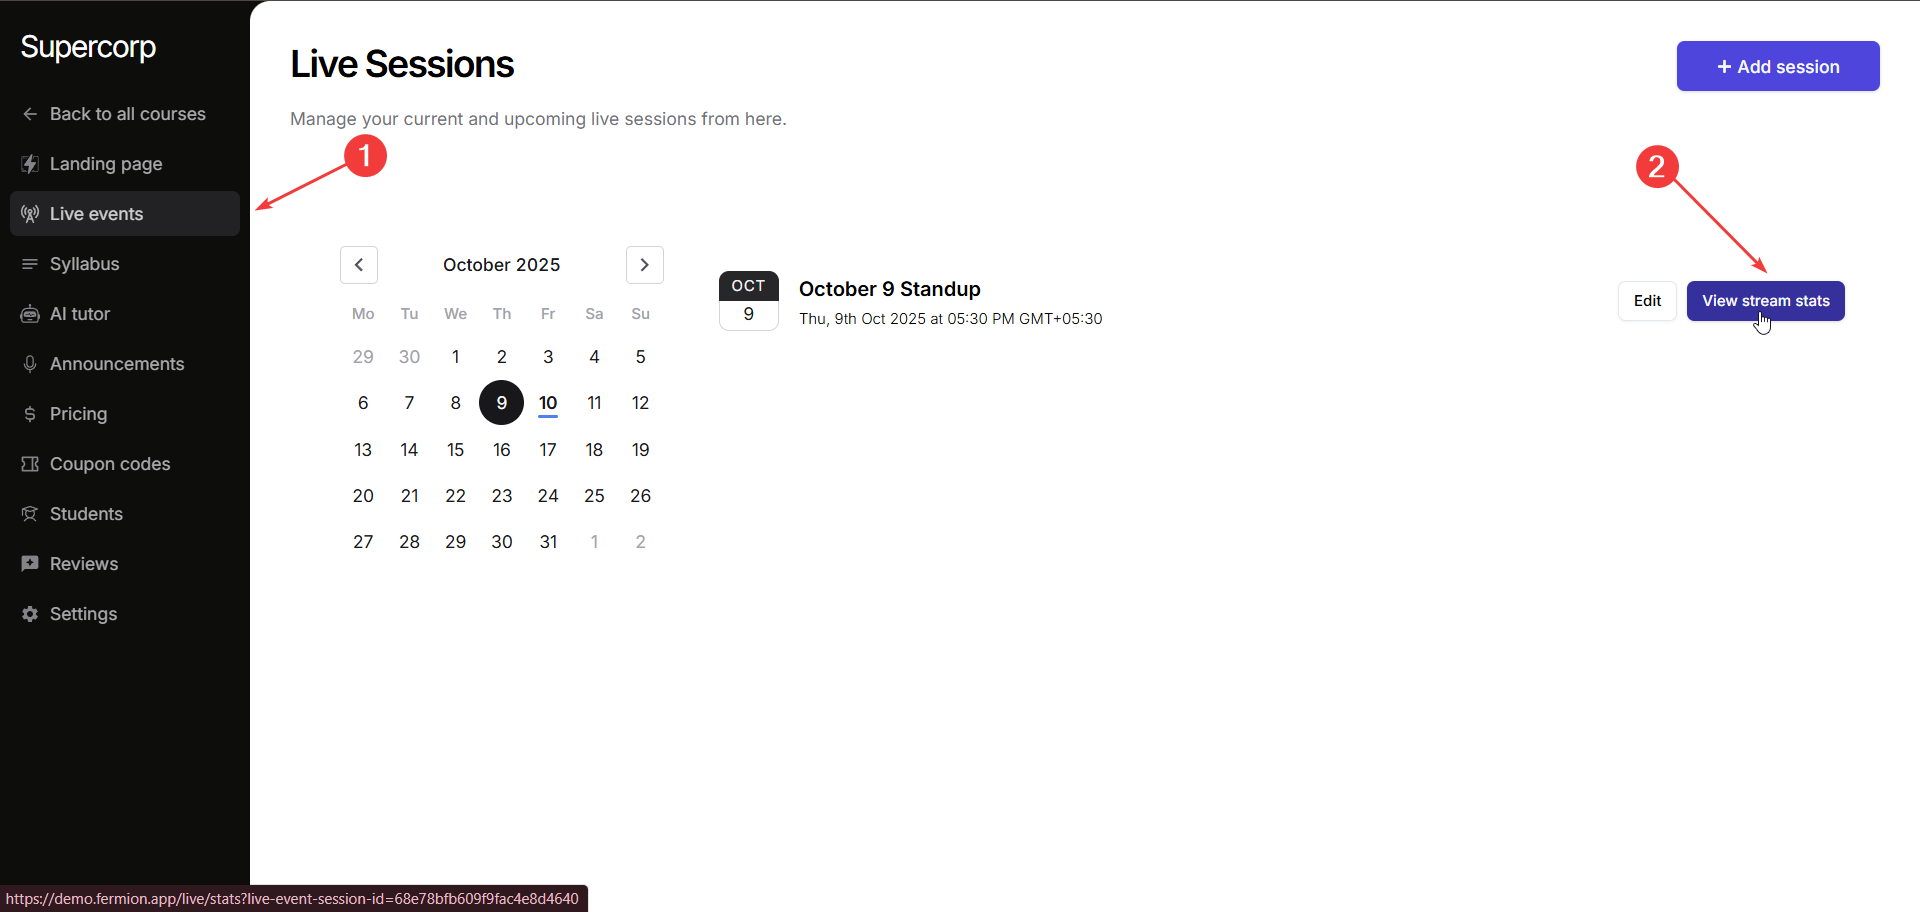
Access via Course Builder
- From the Live Events tab in your course builder, select the date of the livestream you
wish to analyze. 2. Click View stream stats button next to the desired live stream to open
the analytics dashboard.
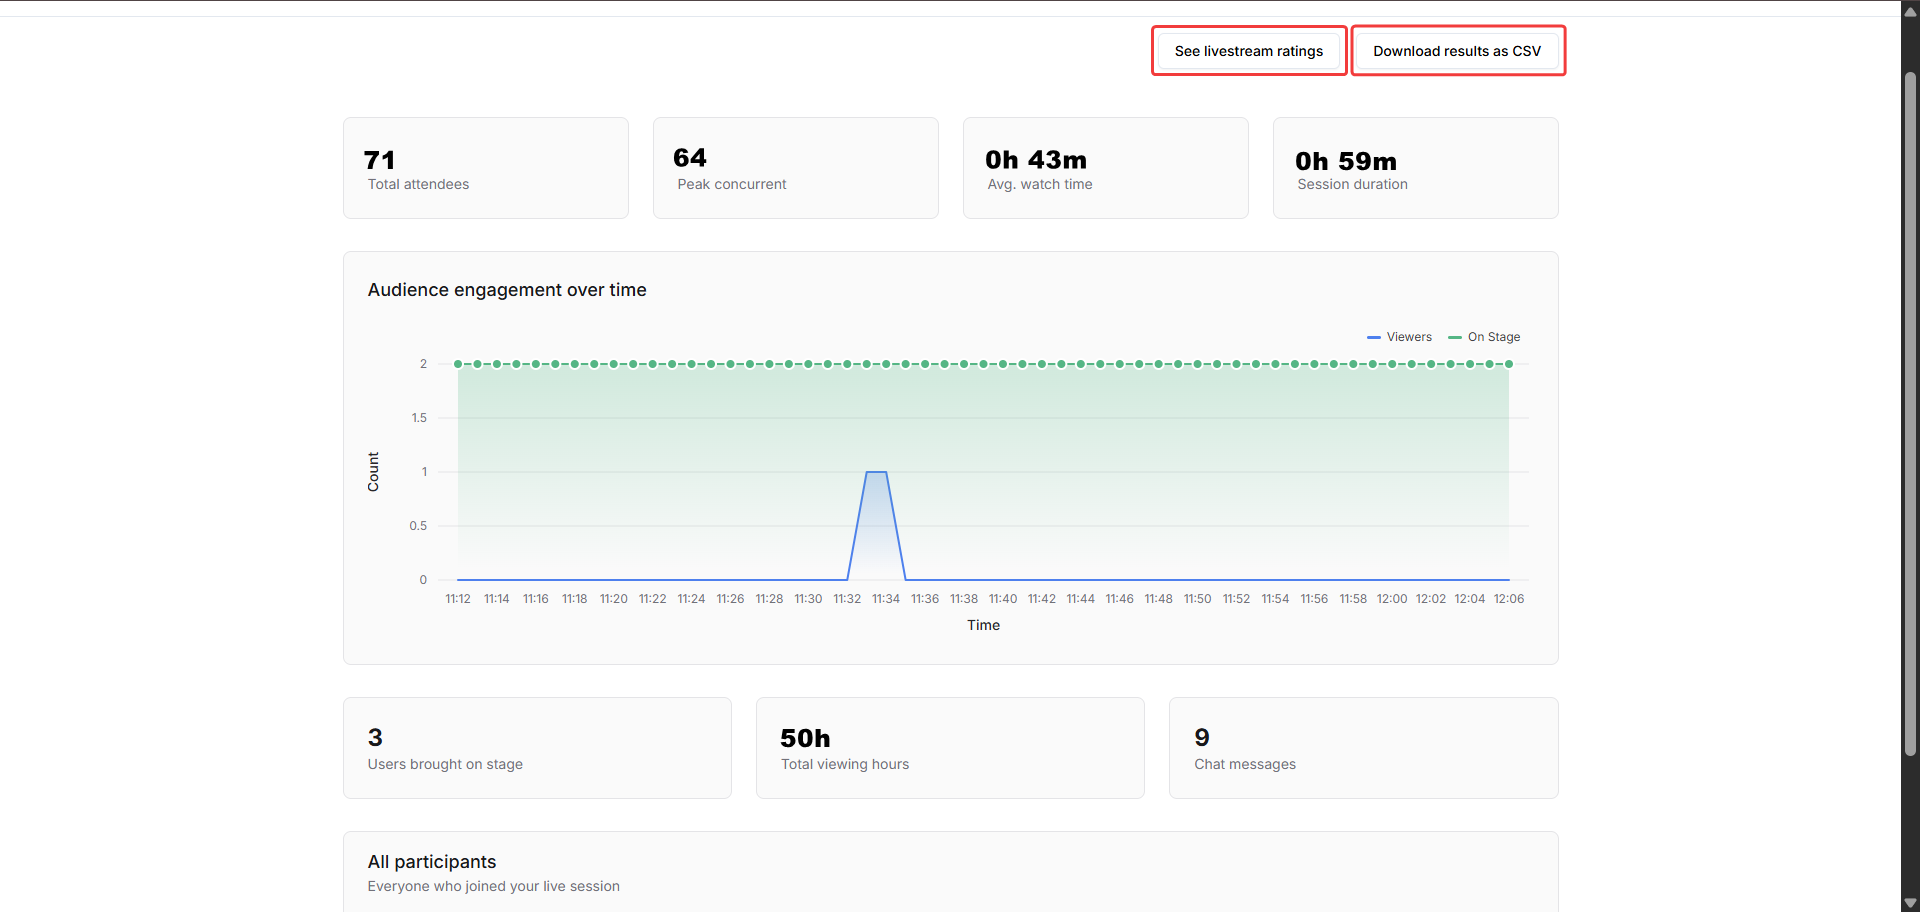
Livestream stats overview
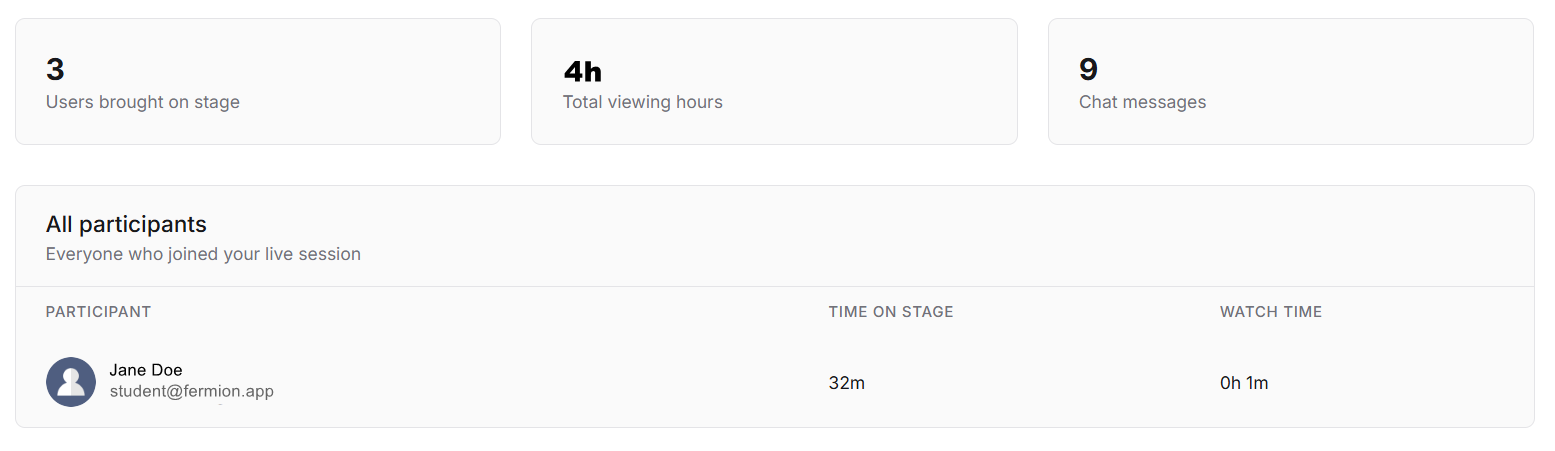
Once you open the analytics page, you’ll see a comprehensive overview of the livestream’s performance metrics:Total attendees: The total number of learners who joined the session.Peak concurrent: The highest number of viewers watching simultaneously.Avg. watch time: The average time each participant spent watching your session.Session duration: The total duration of the livestream.Audience engagement over time: A live graph showing how engagement (viewers, chats, on-stage users) changed throughout the session.Users brought on stage: The number of participants who were invited on stage during the session.Total viewing hours: The cumulative total of all viewers’ watch time.Chat messages: The number of messages sent in the chat during the livestream.
 Below these stats, you’ll find a list of all participants, showing their time on stage and watch time individually, giving you detailed insights into how long each learner stayed and interacted.
Livestream ratings
At the top-right corner of the analytics page, you can access Livestream Ratings: a quick summary of how your viewers rated their session experience.Click the “See livestream ratings” button to see detailed feedback and understand audience satisfaction.
Exporting data
To keep a record or analyze results further, you can download all livestream analytics in a.csv file.Simply click the Download Results as CSV button located at the top-right of the analytics dashboard.