> ## Documentation Index
> Fetch the complete documentation index at: https://docs.fermion.app/llms.txt
> Use this file to discover all available pages before exploring further.
# Analytics
> View student activity, usage insights, and performance metrics for your Fermion-powered school.
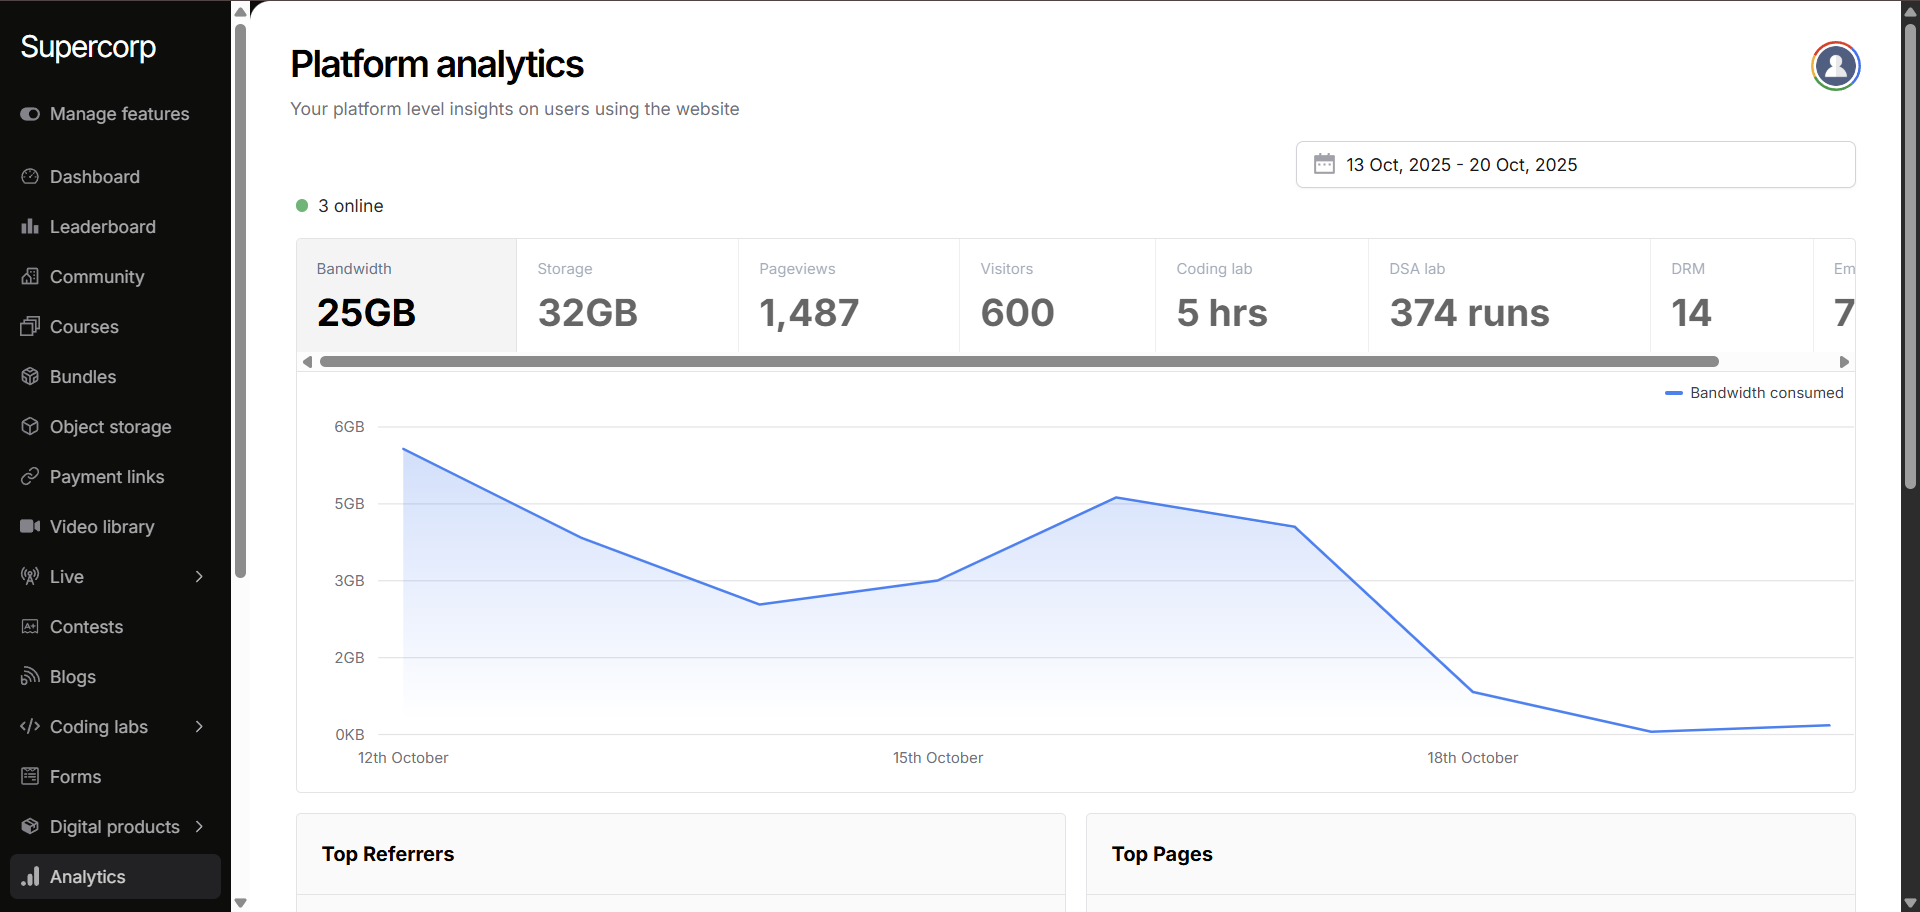
Fermion’s **Analytics** provides a unified view of how your school performs: tracking bandwidth, storage, engagement, and activity across the platform.\
These insights help you optimize learning experiences, monitor system usage, and understand your audience better.
***
## Accessing analytics
Head to your **Instructor Dashboard** after logging into your Fermion school.
In the sidebar, click on **Analytics** to open the analytics dashboard and view performance metrics.
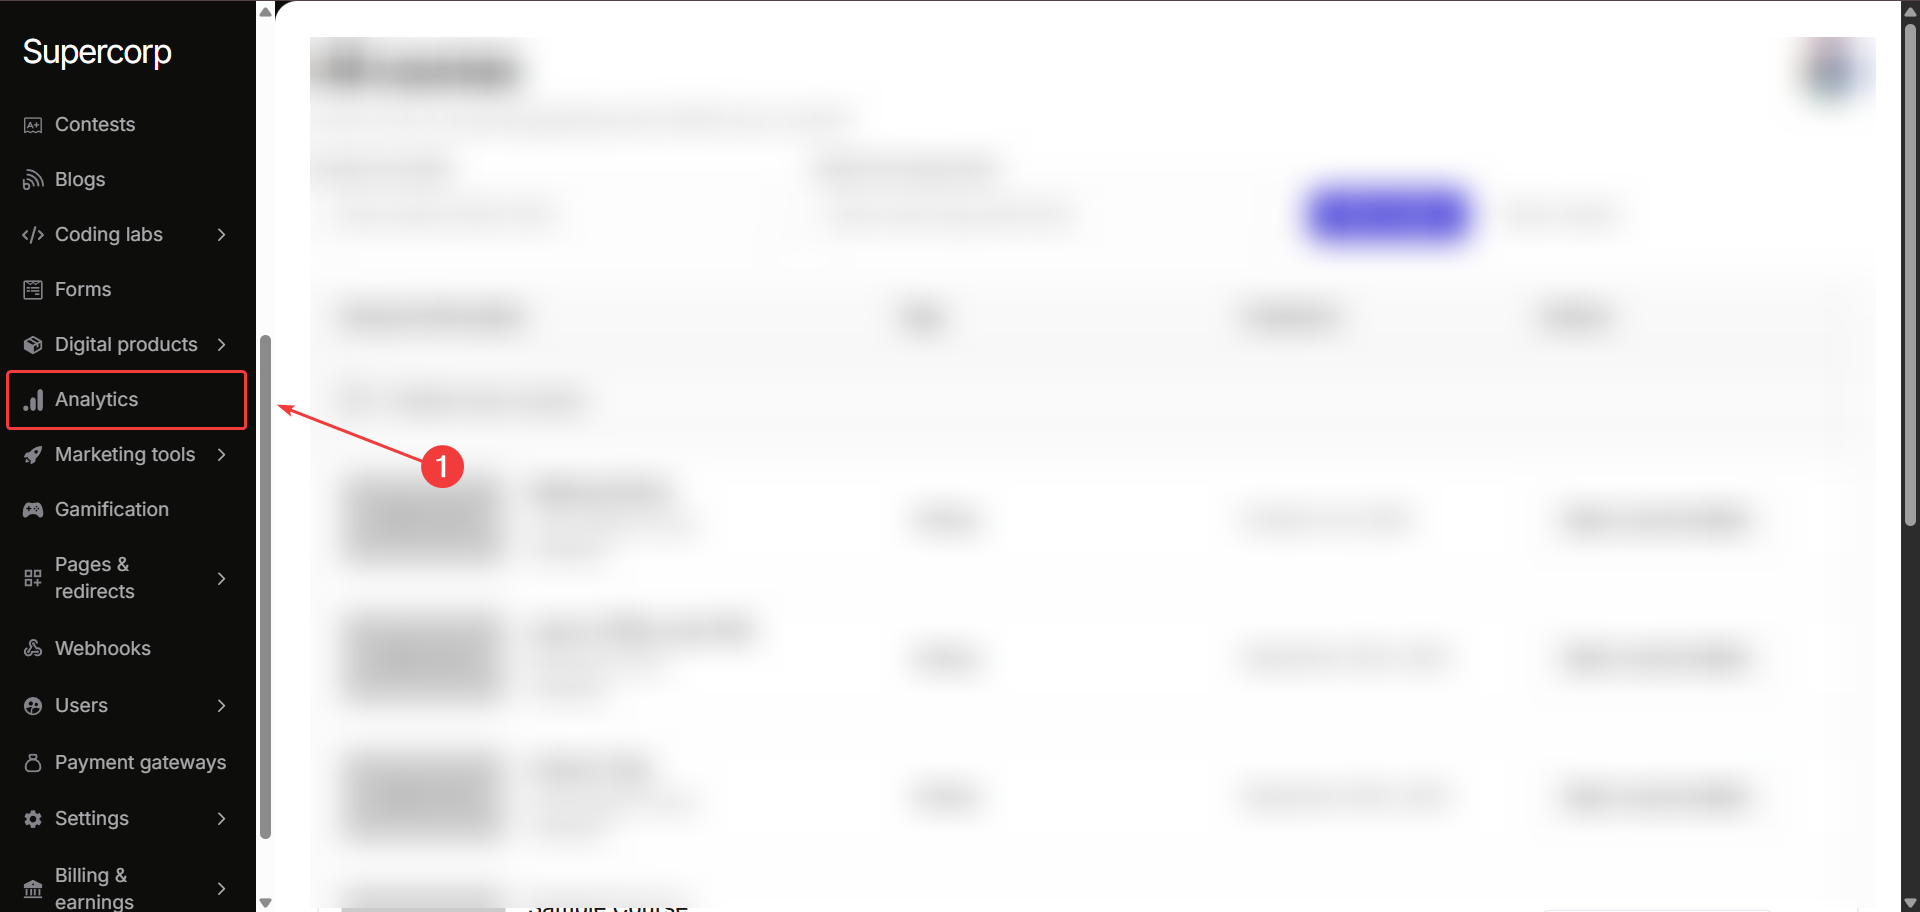
Use the **date filter** to explore real-time data such as bandwidth, storage, traffic, [email](/marketing-tools/email-marketing) performance, and engagement.
## Platform overview
The **Platform analytics** section provides a snapshot of your school’s performance and infrastructure usage. You can filter analytics by date range using the date selector on the top right.
Shows total **bandwidth** used by your school for all hosted content - including [video](/recorded-videos/introduction), labs, and API calls. This metric is used for **bandwidth overage billing**.
Displays total **storage space** occupied by your uploaded files, videos, and resources. Exceeding your plan’s quota may lead to **storage overages**.
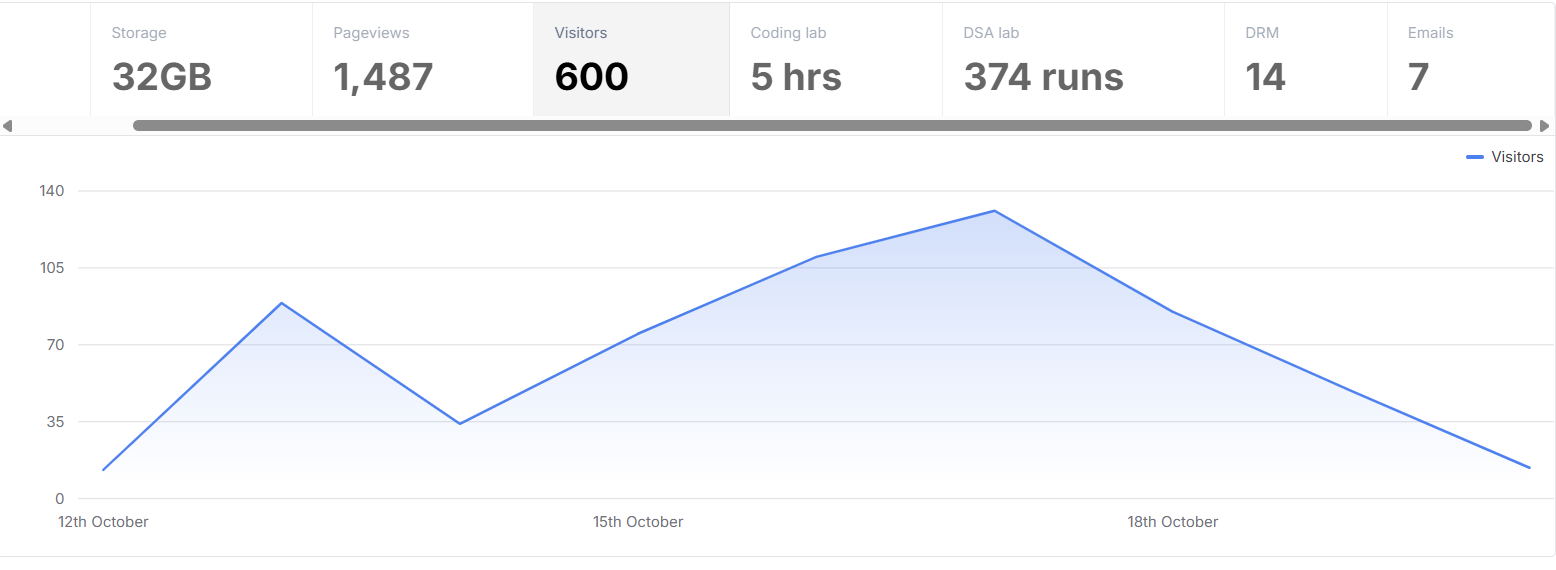
View total **page-views** and unique **visitors** over the selected time range. This helps you understand how new and distinct learners interact with your content.
Monitor **[coding lab activity](/creating-coding-labs/what-are-coding-labs)** (hours spent) and [DSA lab](/creating-io-coding-labs/introduction) runs (executions). Useful for tracking student engagement and lab infrastructure usage for your entire school.
Track all outgoing communication from your school through [email](/marketing-tools/email-marketing), including:
* **Emails sent:** Total number of emails dispatched.
* **Emails bounced:** Emails that failed to deliver.
* **Marked as spam:** Emails flagged by users or email providers as spam.
* **Unsubscribed users:** Number of users who opted out of future emails.
Monitor the number of **[Digital Rights Management (DRM)](/live-classes/drm-and-watermarking)** licenses utilized across your hosted video content.Each DRM license corresponds to a secured video playback instance.
***
## Engagement & traffic insights
The lower section of the analytics page shows detailed engagement and audience insights.\
These metrics help you identify where users come from, what pages they visit most, and what devices or browsers they use.
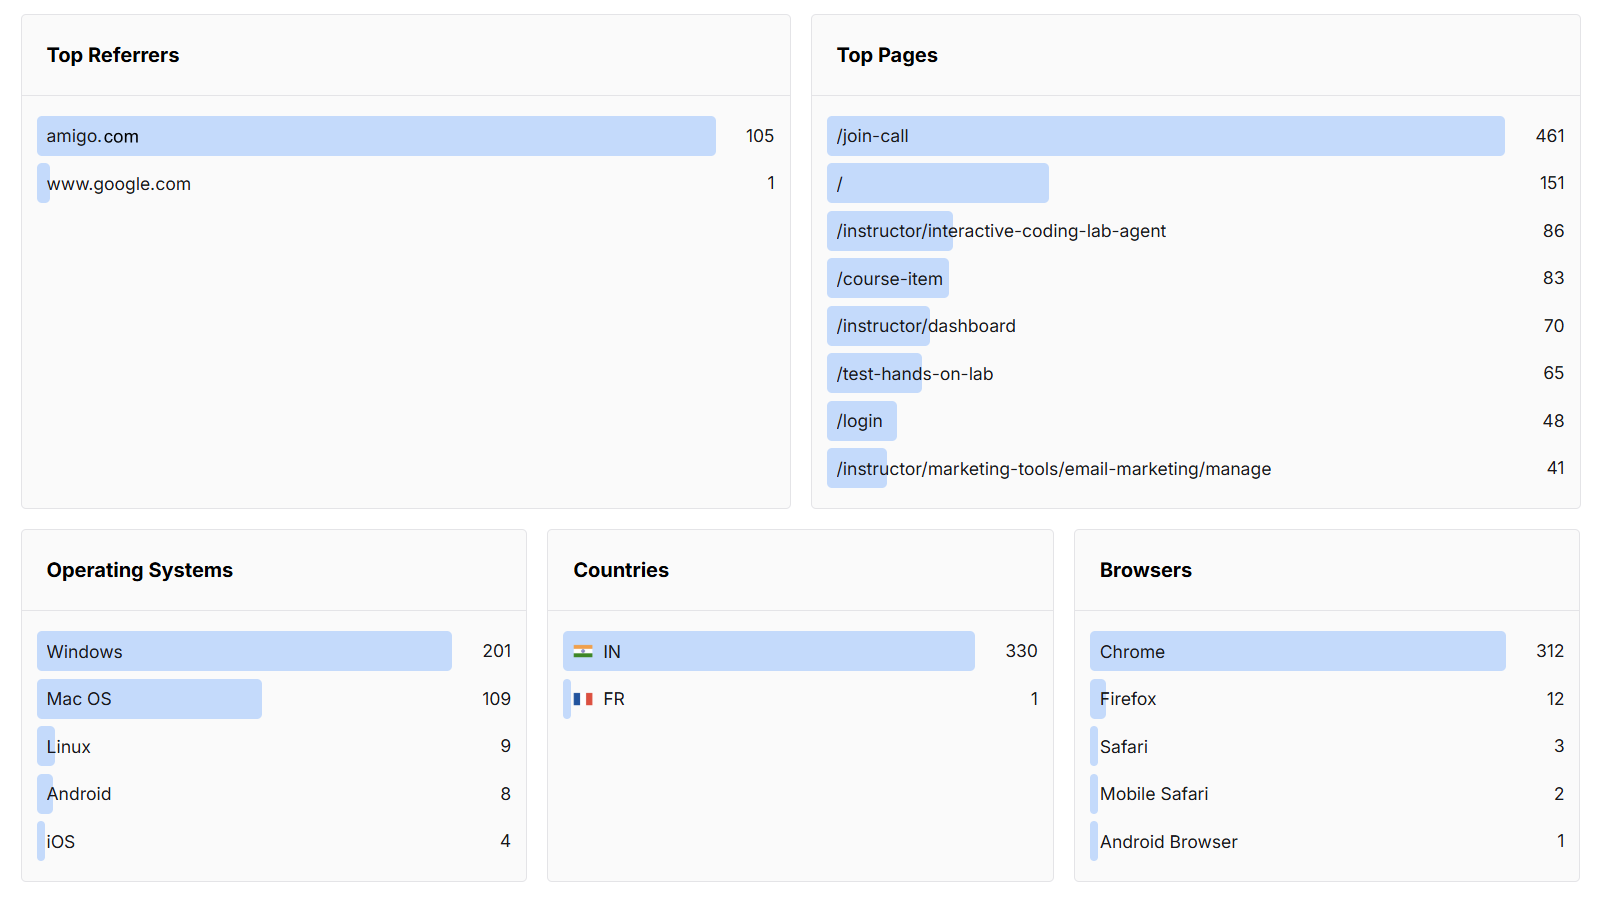
Lists the top external sources that drive visitors to your school (e.g., social media, partner websites, or search engines).
Displays your most visited pages and routes (such as `/join-call`, `/course-item`, or `/dashboard`). This helps to identify your most popular pages across school.
Shows what **devices (Operating System) and browsers** your users are accessing the platform from.
View where your users are located, including **countries**, to understand your global reach.
Your **Analytics Dashboard** is the single source of truth for how Fermion bills you for **usage and overages**. Metrics like **bandwidth consumed**, **storage used**, and **DRM licenses** directly influence your monthly billing.
Fermion’s pricing is **transparent and usage-based**, ensuring you only pay for what you actually consume. Head over to the [Fermion Pricing](https://fermion.app/pricing) page to learn more about plan limits and overage calculations.
***
## Access analytics via API
You can also access your analytics programmatically through Fermion’s API. Head over to our [API documentation](/api-guide/introduction) to learn more.
The following API endpoints are available to access user and school analytics over API:
#### Sales Data
* **Get sales data with filtering**: `POST`
#### User Progress
* **Get user bundle progress for all bundles**: `POST`
* **Get all courses progress of a given user**: `POST`
* **Get user bundle progress for specific bundle**: `POST`
* **Get individual user course progress**: `POST`
All requests require authentication using the `FERMION-API-KEY` header.
These endpoints let you programmatically retrieve progress, completion, and sales analytics to integrate with your dashboards or reporting tools.
## Next steps
Learn how to add, remove, and assign roles to instructors within your school.\
[Read instructor management guide](/manage-settings/manage-instructors)
Understand how to view and control user access in your school.\
[View user management guide](/manage-settings/manage-users)